Skip to content

Task 12: Hands-On Monitoring & Alerting with Node Exporter, Prometheus, and Grafana Dashboards

In this guide, we’ll explore how to monitor cpu and memory usage on a server using Node Exporter as exposer, prometheus as collector, and Grafana as visualizer/Dashboard. At the end, we will create an alert based on usage.

Project Challange

Buat 1 Monitoring CPU & Memory Usage Menggunakan tools Grafana untuk visualisasi dan Prometheus sebagai collector. Gunakan Node Exporter sebagai exposer.

Buat alert untuk cpu/memory usage dan notification di kirim ke discord.

Note

Architecture Overview

architecture

source: my own

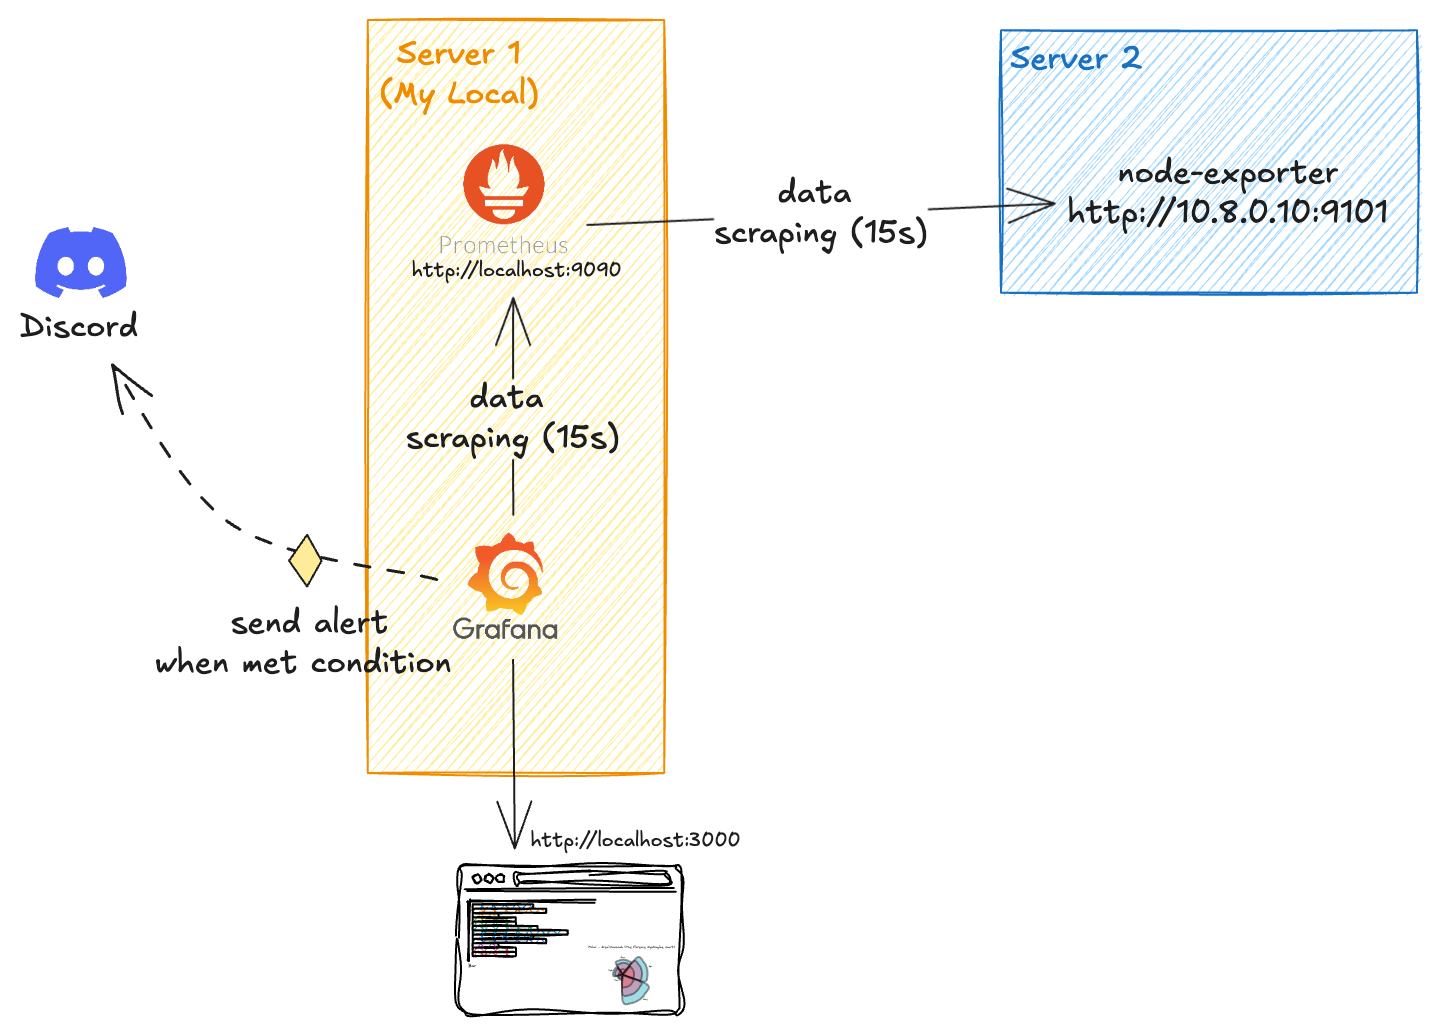
In this architecture, Server 2 will have Node Exporter installed to expose usage metrics from that server. Server 1, on the other hand, will host Prometheus as the database and Grafana as the visualization and alerting tool. Prometheus on Server 1 will scrape data from Server 2’s Node Exporter every 15 seconds. The collected data will be stored in Prometheus, and Grafana will then scrape this data from Prometheus every 15 seconds to update its visualizations. If predefined conditions are met based on the alert rules, Grafana will send notifications to Discord accordingly.

1. Know What Metrics you want to Monitor

Before we dive into the setup, let’s establish what metrics we want to monitor. In this article, we’ll focus on tracking cpu and memory usage on our server using Prometheus and its Node Exporter. Understanding memory and cpu usage is critical for maintaining system performance and preventing issues like slowdowns or crashes due to resource exhaustion.

  • Memory

    for memory explanation, i just write about that in Monitoring Server Memory Usage with Prometheus Node Exporter. Please read that first.

  • CPU

    To monitor CPU usage effectively, we’ll use Node Exporter to expose system metrics and Prometheus to collect them, focusing on the node_cpu_seconds_total metric. This metric tracks the total time the CPU spends in various modes (like user, system, and idle) allowing us to calculate usage as a percentage.

    A simple yet powerful PromQL query: 100 - (avg(rate(node_cpu_seconds_total{mode="idle"}[3m])) * 100), gives us the average CPU usage across all cores over a 3-minute window by subtracting idle time from the total. High CPU usage can indicate heavy workloads or potential bottlenecks, making this metric essential for maintaining server performance.

2. Setup Prometheus and Node Exporter

I’m using two servers for this setup:

  • Server 1 (local) runs Prometheus to collect data and Grafana to visualize it.
  • Server 2 (IP: 10.8.0.10) runs Node Exporter to expose metrics from itself.

Here’s a summary of the setup:

Server Role IP Address Description
Server 1 Prometheus localhost:9090 Collects and stores metrics
Server 1 Grafana localhost:3000 Vizualises metrics
Server 2 Node Exporter 10.8.0.10 Exposes memory and system metrics

2.1 Install Node Exporter on Server 2

We’ll install Node Exporter on Server 2 using Docker Compose for its simplicity and ease of management.

docker-compose.nodeexporter.yml
version: '3.8'

services:
    node-exporter:
        image: prom/node-exporter:v1.9.0
        ports:
            - "9101:9100"
        volumes:
            - /proc:/host/proc:ro # (1)
            - /sys:/host/sys:ro # (2)
            - /:/rootfs:ro # (3)
        command:
            - '--path.procfs=/host/proc'
            - '--path.sysfs=/host/sys'
            - '--collector.filesystem.ignored-mount-points=^/(sys|proc|dev|host|etc)($$|/)' # (4)
            - '--collector.cpu' # (5)
            - '--collector.meminfo'
            - '--collector.filesystem'
            - '--collector.netdev'
            - '--no-collector.arp' # (6)
            - '--no-collector.bcache'
            - '--no-collector.bonding'
            - '--no-collector.conntrack'
            - '--no-collector.diskstats'
            - '--no-collector.entropy'
            - '--no-collector.filefd'
            - '--no-collector.hwmon'
            - '--no-collector.zfs'
        deploy: # (7)
            resources:
                limits:
                    cpus: '0.2'
                    memory: 128M
        logging: # (8)
            driver: "json-file"
            options:
                max-size: "10m"
                max-file: "3"
  1. Mounting /proc: This volume mounts the host's /proc filesystem to the container, allowing Node Exporter to access process information.
  2. Mounting /sys: This volume mounts the host's /sys filesystem to the container, enabling access to system information.
  3. Mounting /: This volume mounts the root filesystem of the host to the container, allowing Node Exporter to access filesystem metrics.
  4. Ignoring Certain Mount Points: This command-line argument tells Node Exporter to ignore specific mount points (like /sys, /proc, etc.) when collecting filesystem metrics.
  5. Enabling CPU Collector: This command-line argument enables the CPU collector, allowing Node Exporter to gather CPU-related metrics.
  6. Disabling ARP Collector: This command-line argument disables the ARP collector, which is not needed in most cases.
  7. Resource Limits: This section sets resource limits for the container, ensuring it doesn't consume too much CPU or memory.
  8. Logging Options: This section configures logging options for the container, including log rotation settings.

2.2 Install Prometheus and Grafana on Server 1

We’ll install Prometheus on Server 1 using Docker Compose (i love you docker compose) for its simplicity and ease of management.

Structure repository
.
├── docker-compose.monitoring.yml
├── prometheus.yml
docker-compose.monitoring.yml
version: '3.8'

services:
    prometheus:
        image: prom/prometheus:v3.2.1
        ports:
            - "9090:9090"
        volumes:
            - ./prometheus.yml:/etc/prometheus/prometheus.yml
            - prometheus_data:/prometheus
        command:
            - '--config.file=/etc/prometheus/prometheus.yml'
            - '--storage.tsdb.path=/prometheus'
            - '--storage.tsdb.retention.time=90d'
            - '--storage.tsdb.wal-compression'
        deploy:
            resources:
                limits:
                    cpus: '0.5'
                    memory: 1G
        networks:
            - monitoring
        logging:
            driver: "json-file"
            options:
                max-size: "10m"
                max-file: "3"

    grafana:
        image: grafana/grafana:11.5.2
        ports:
            - "3000:3000"
        volumes:
            - grafana_data:/var/lib/grafana
            - ./grafana-provisioning/datasources:/etc/grafana/provisioning/datasources
        environment:
            - GF_SECURITY_ADMIN_USER=adminuser
            - GF_SECURITY_ADMIN_PASSWORD=admin123
            - GF_AUTH_ANONYMOUS_ENABLED=false
        depends_on:
            - prometheus
        deploy:
            resources:
                limits:
                    cpus: '0.5'
                    memory: 512M
        networks:
            - monitoring
        logging:
            driver: "json-file"
            options:
                max-size: "10m"
                max-file: "3"
volumes:
    prometheus_data:
    grafana_data:

networks:
    monitoring:
        driver: bridge
prometheus.yml
global:
    scrape_interval: 15s

scrape_configs:
- job_name: 'prometheus'
    static_configs:
    - targets: ['localhost:9090']

- job_name: 'node-exporter'
    static_configs:
    - targets: ['10.8.0.10:9101']
Run
docker-compose -f docker-compose.monitoring.yml up -d

3. Check Prometheus

Now we can access prometheus on my server 1 by http://localhost:9090

Step Check Prometheus

mem-total

source: my own

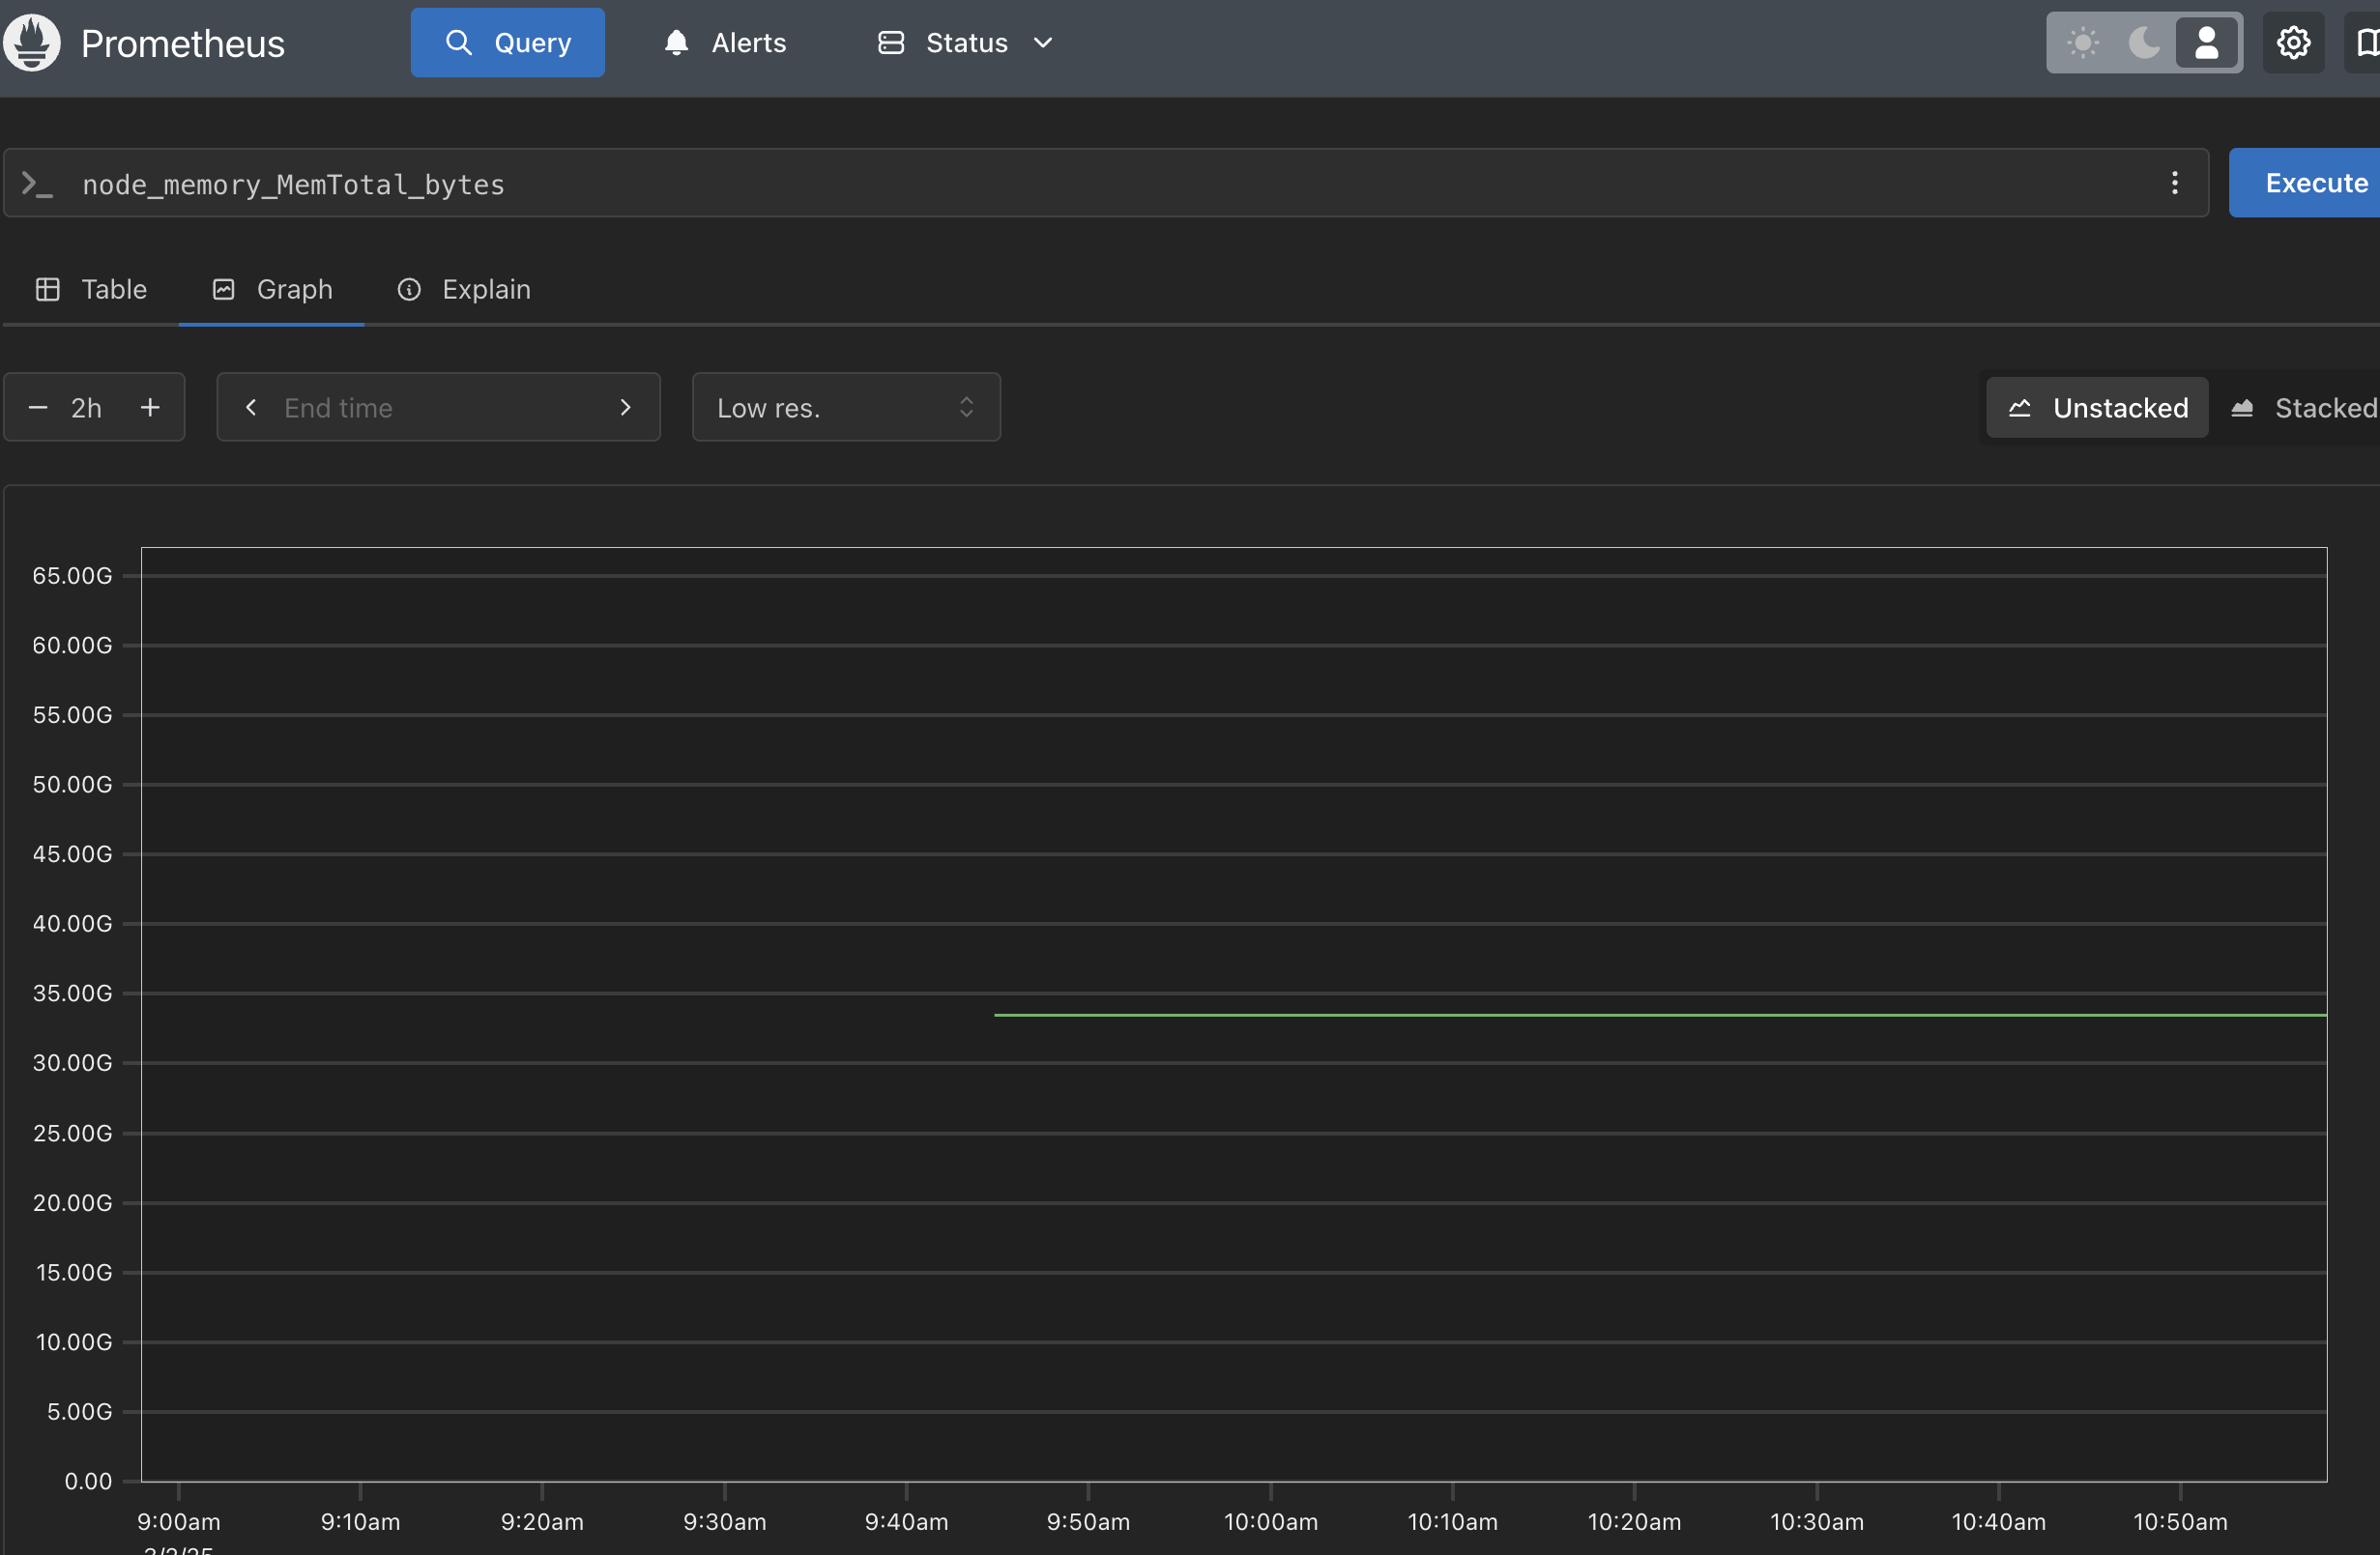
This prometheus dashboard shows the total memory on the server. Based on the graph, we can see that the total memory is 31GB.


mem-available

source: my own

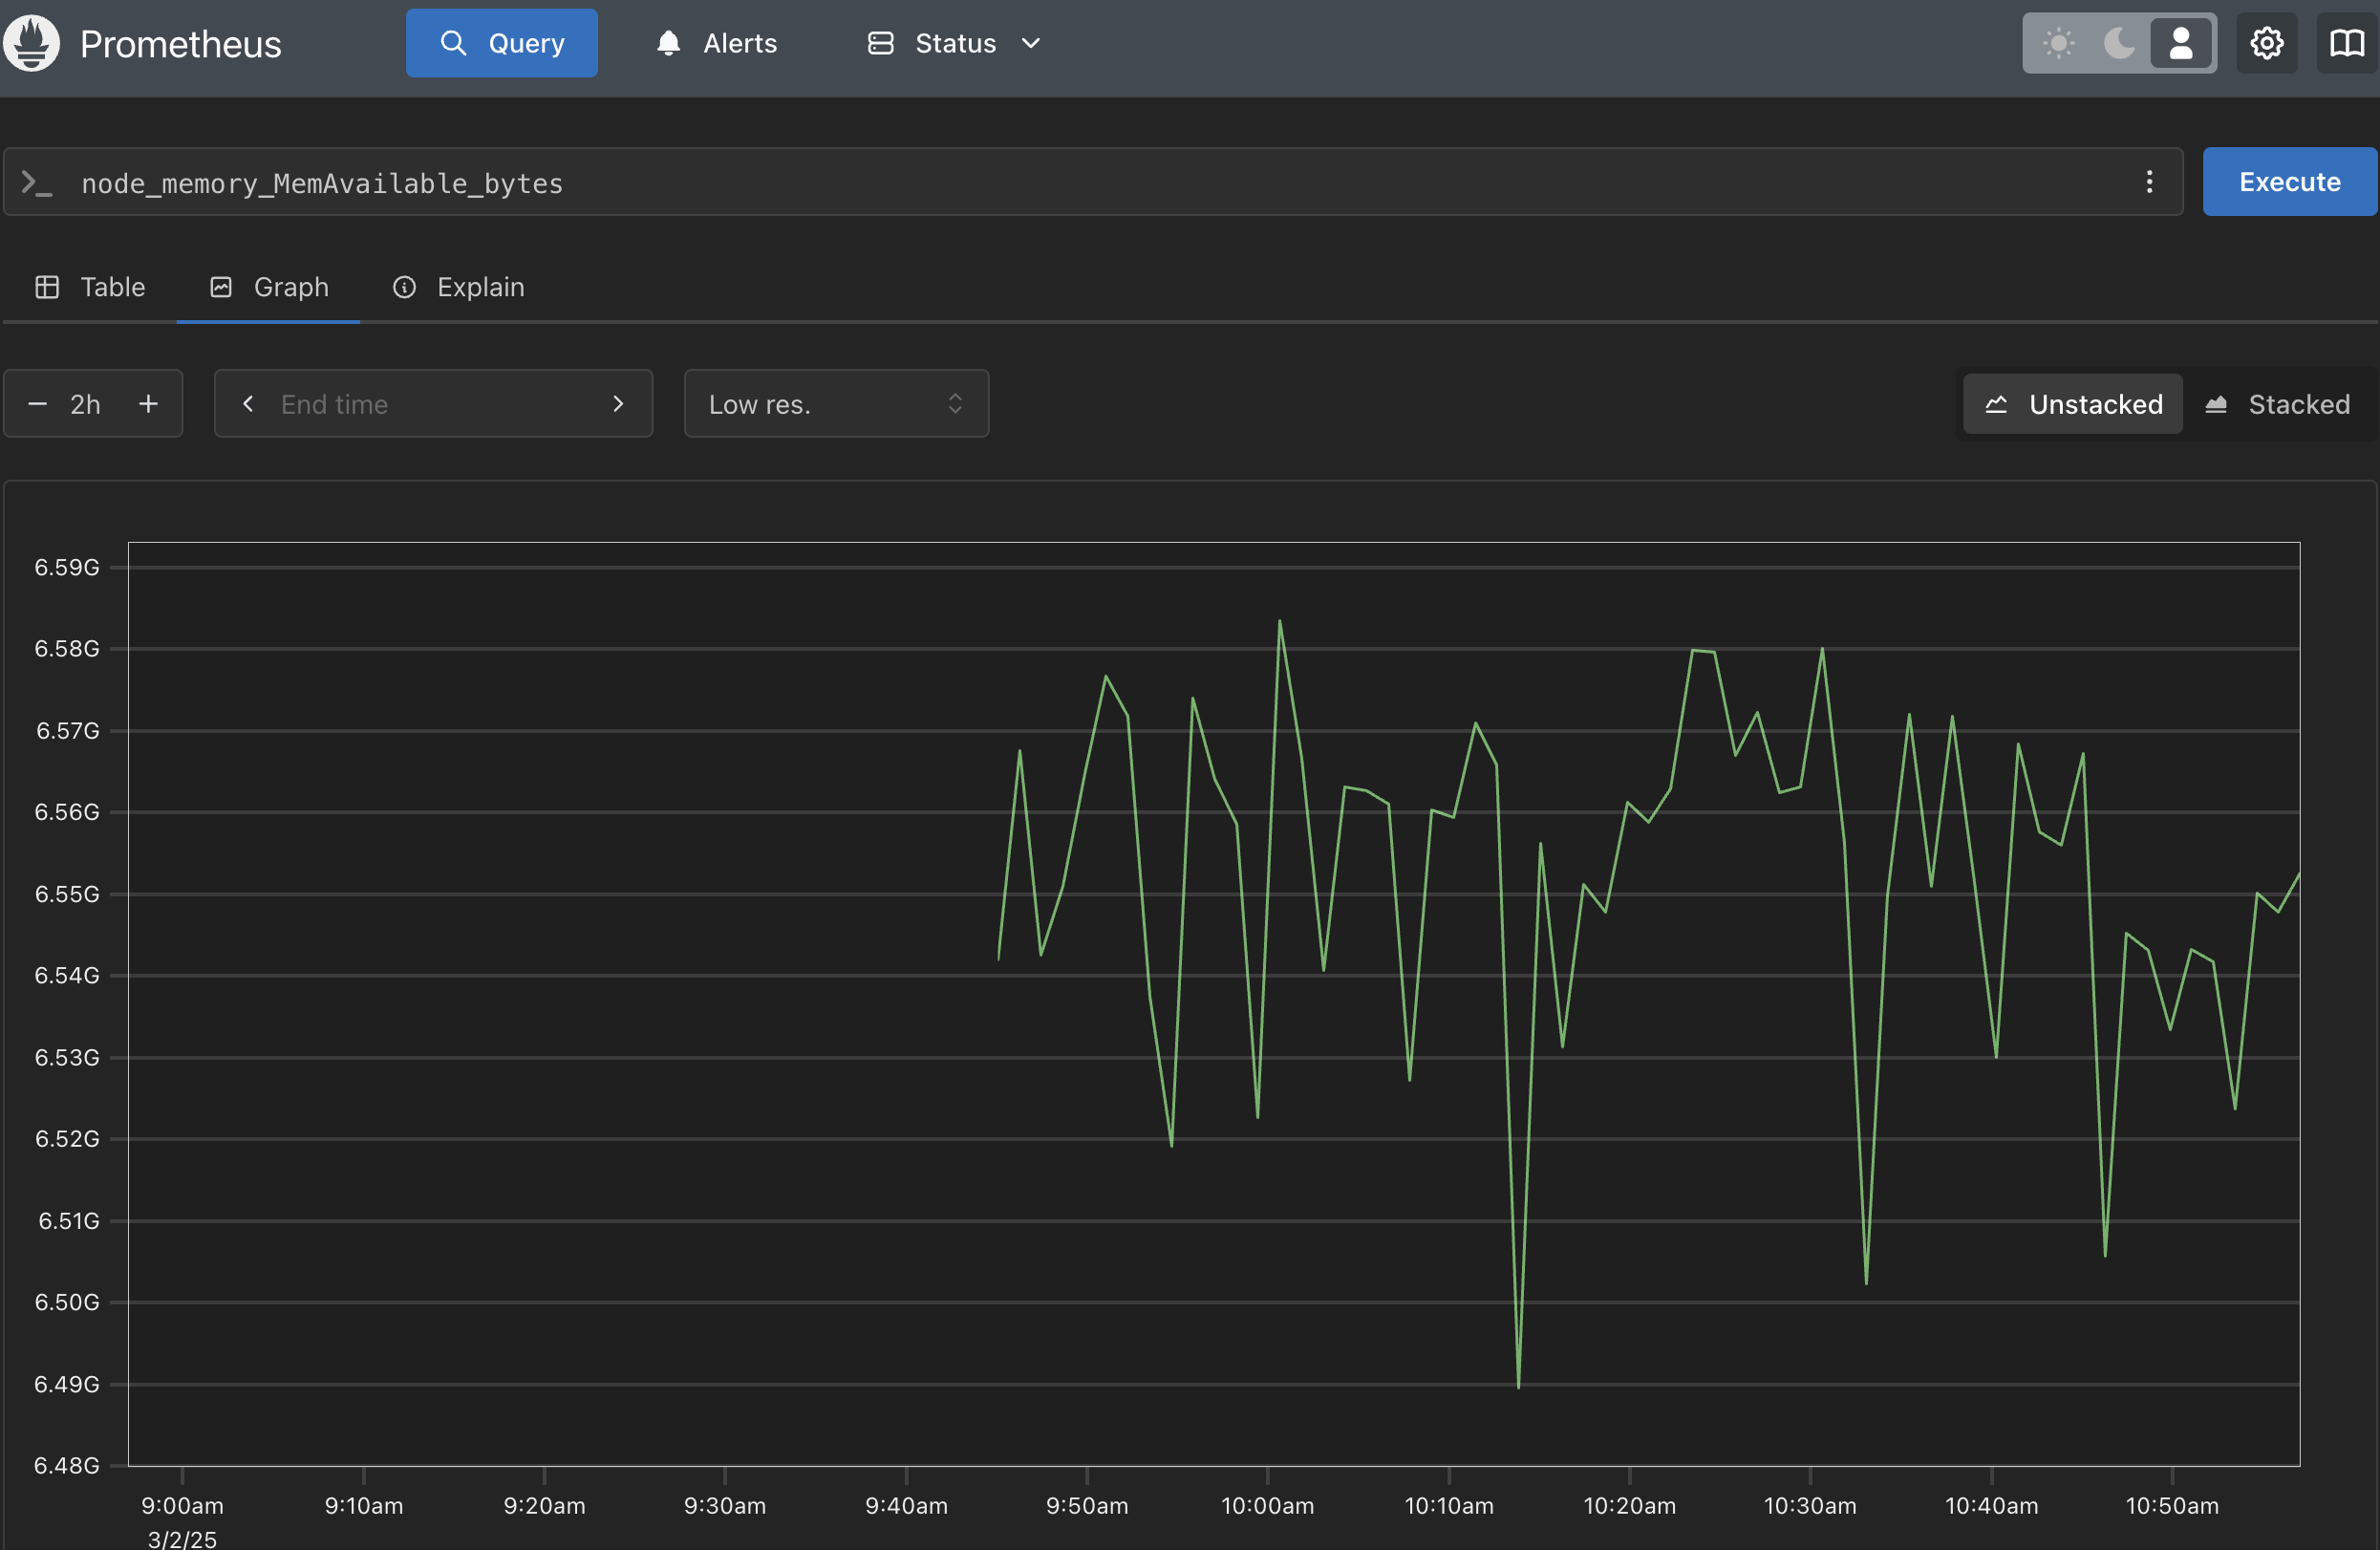
This prometheus dashboard shows the total avail memory on the server. Based on the graph, we can see that the avail memory is around 6.1GB.


mem-available

source: my own

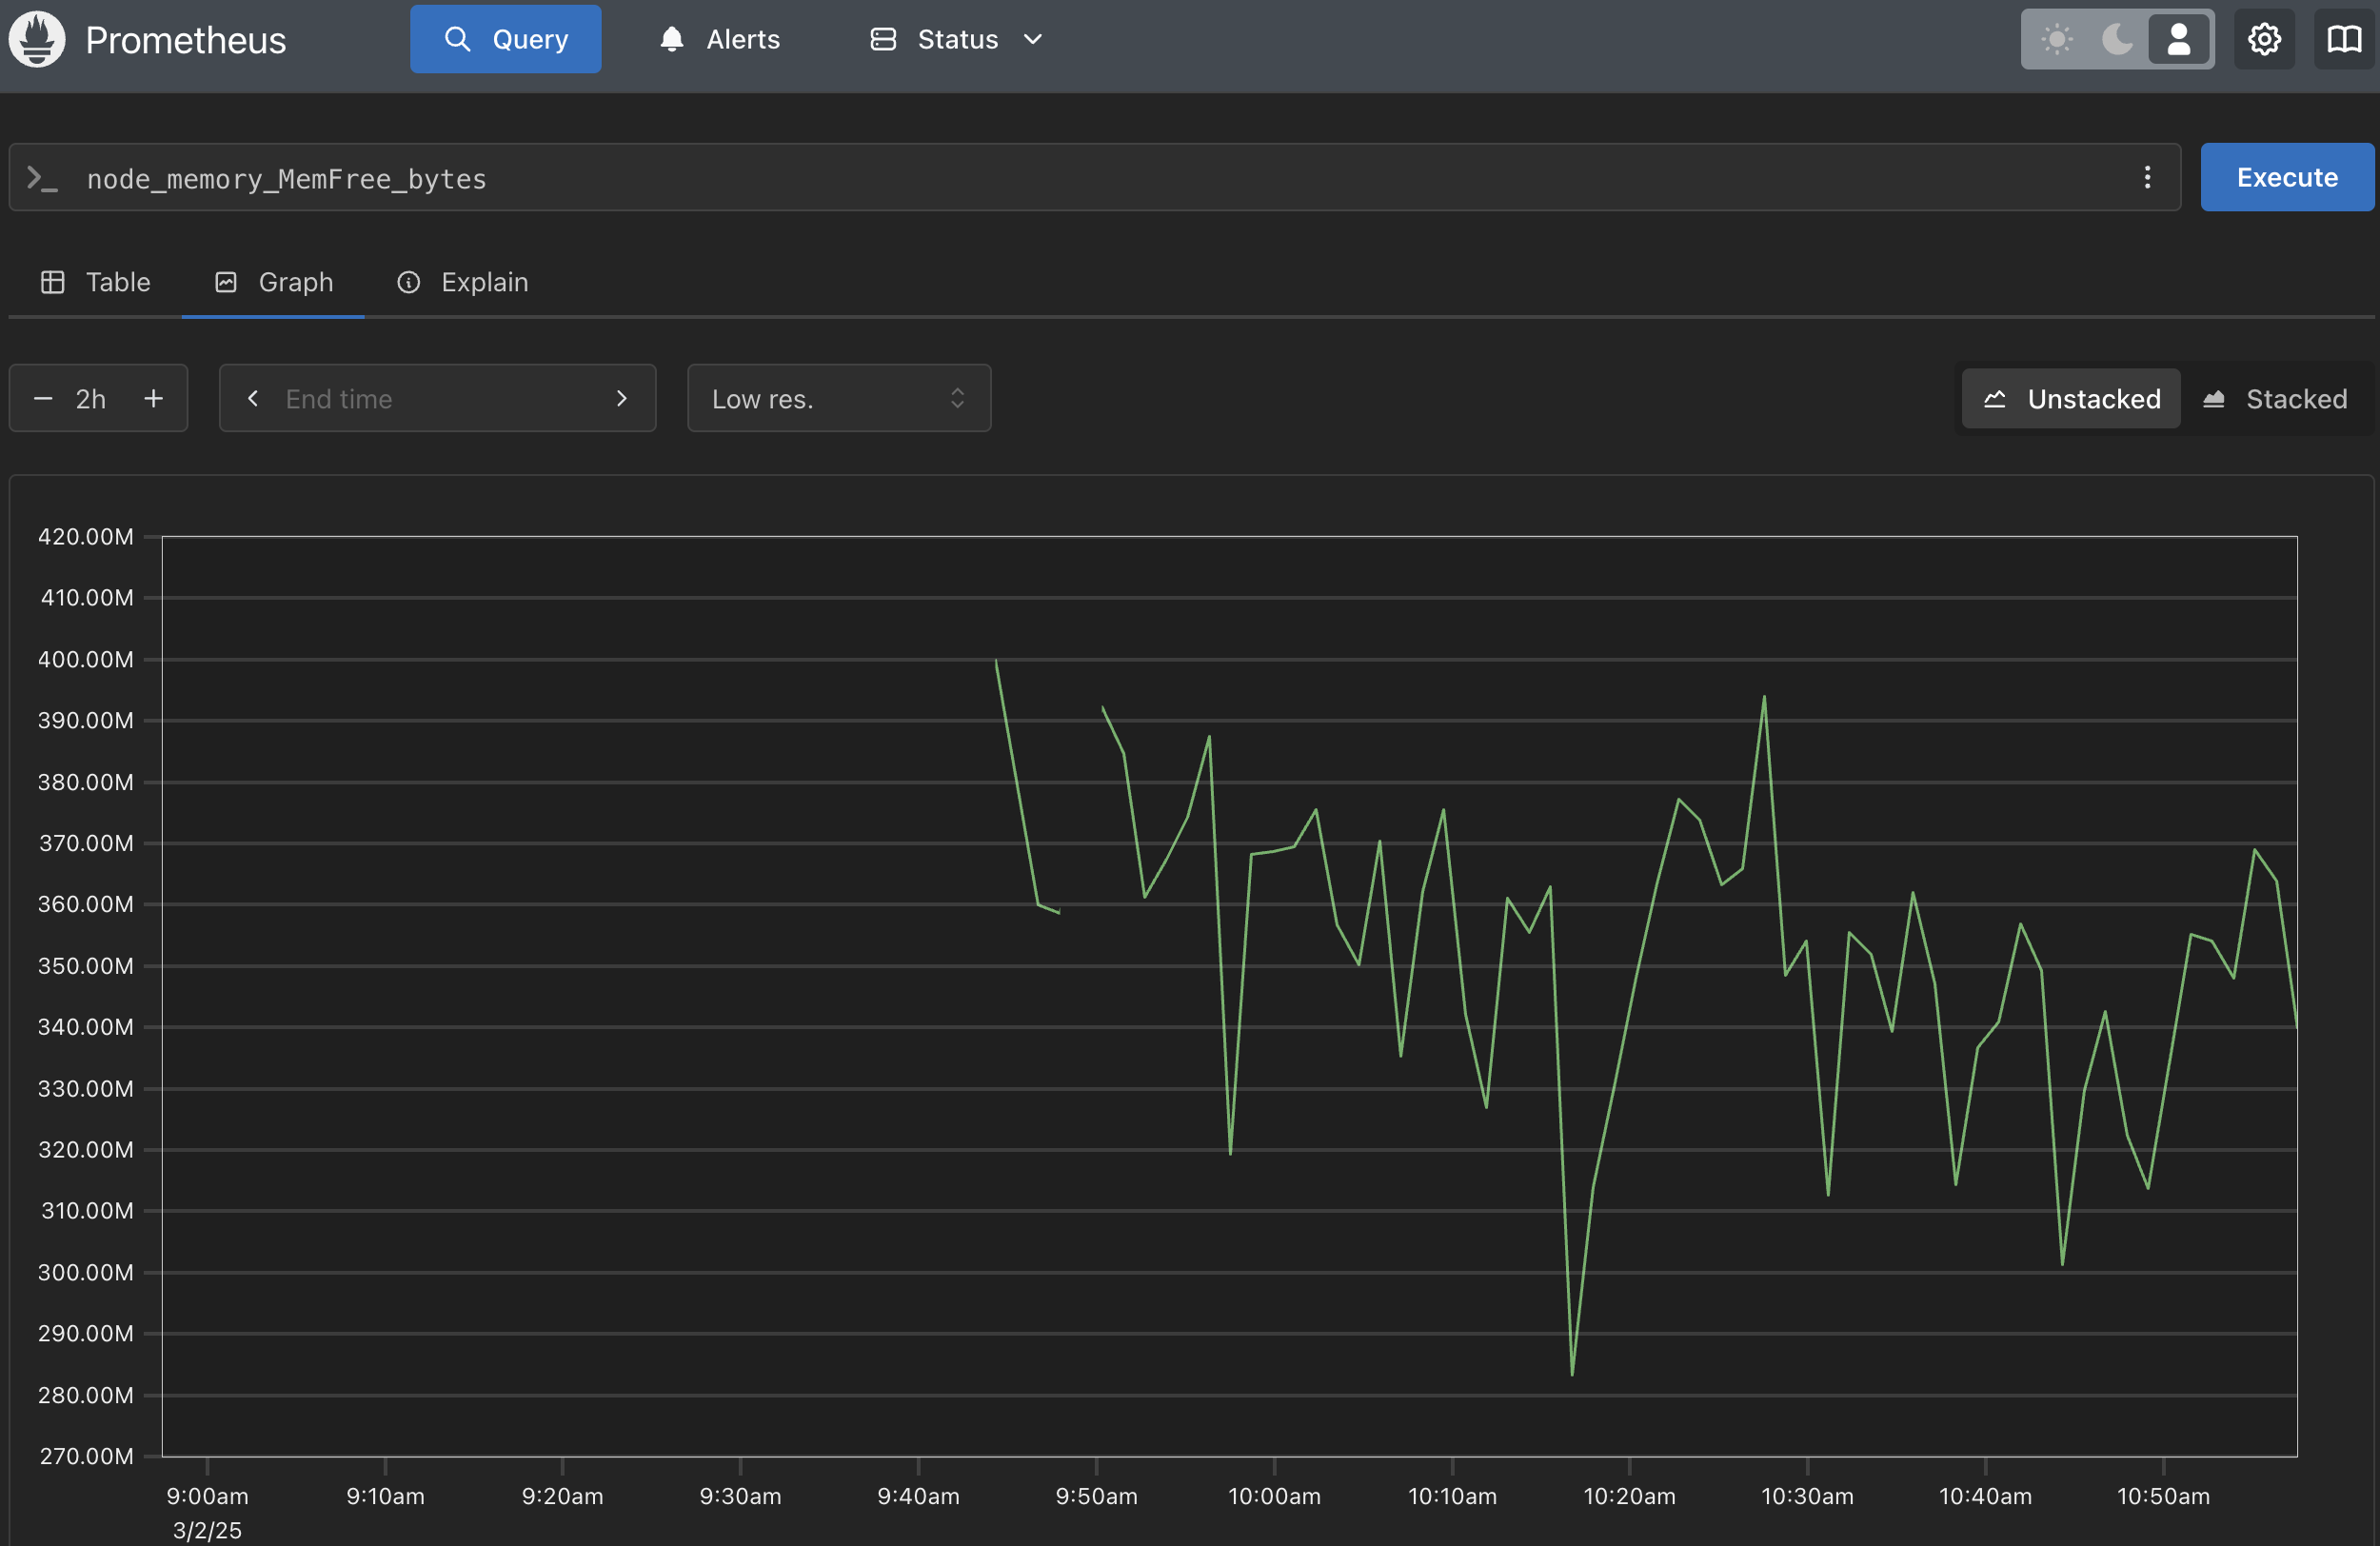
This prometheus dashboard shows the total free memory on the server. Based on the graph, we can see that the free memory is between 0.3GB and 0.4GB.


mem-available

source: my own

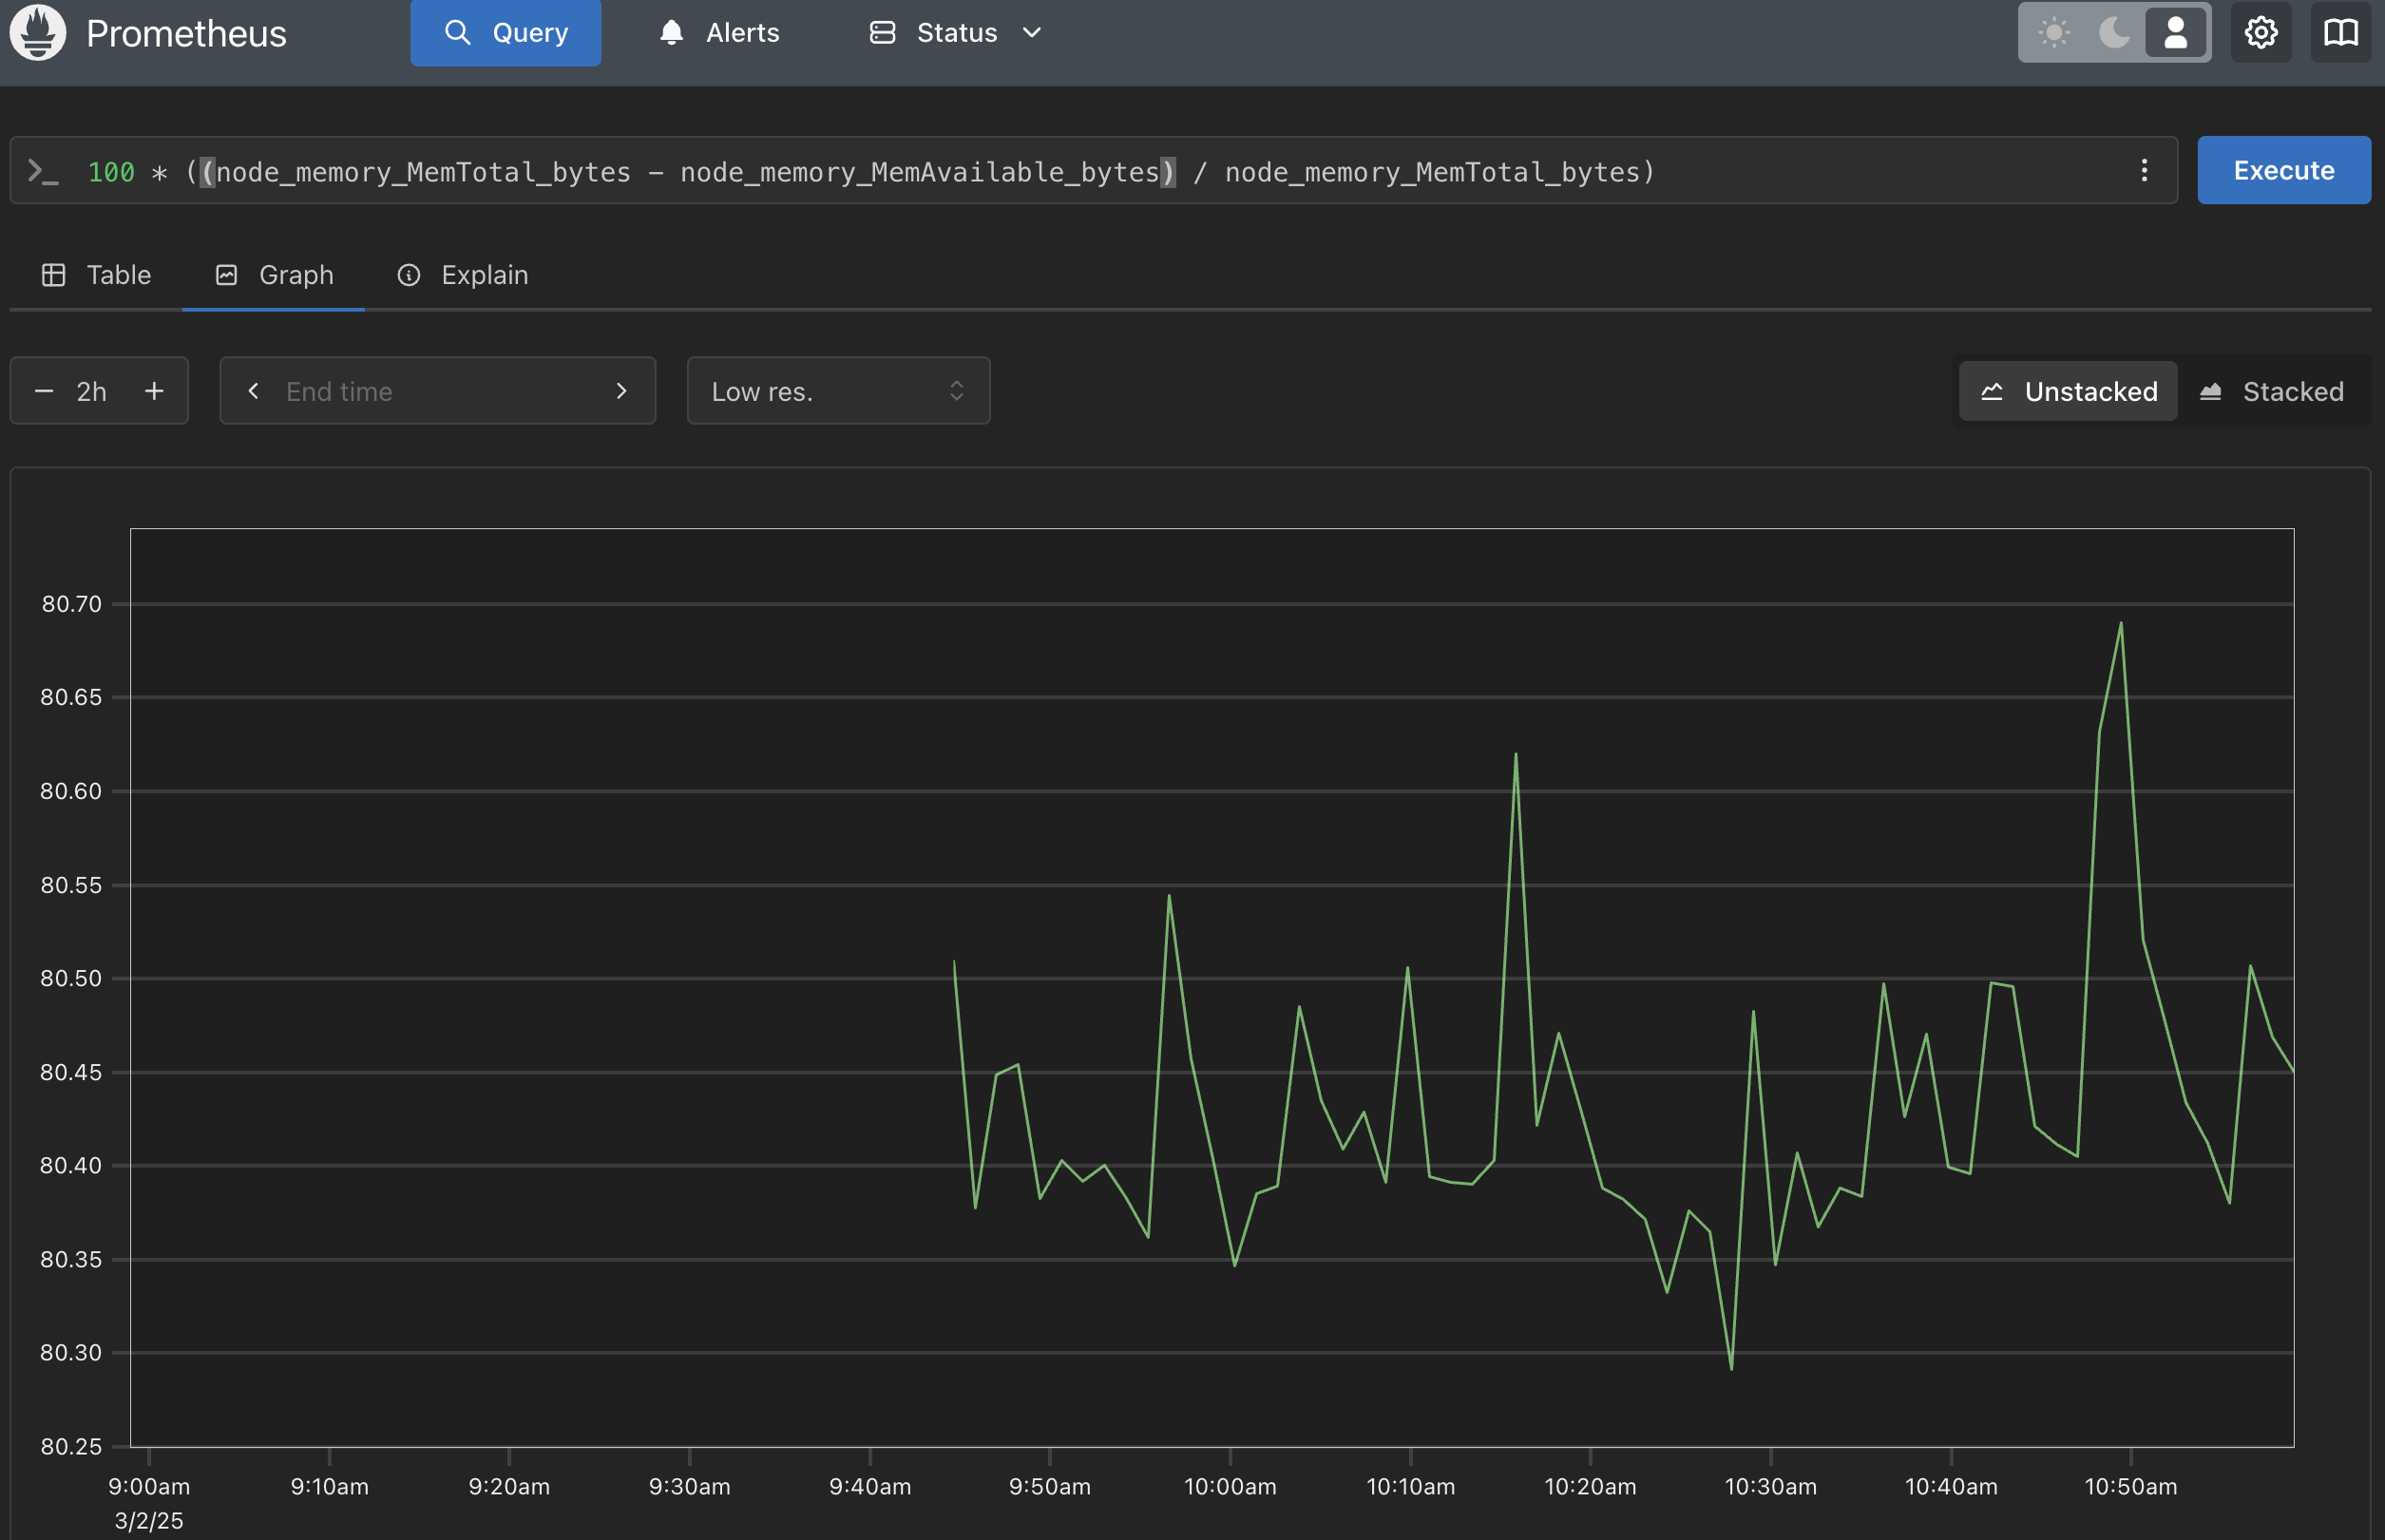
This prometheus dashboard shows the total memory usage on the server. Based on the graph, we can see that the memory usage is around 24GB. To get this in percentage, we can use this formula:

100 * (total memory - avail memory) / total memory

# illustration:
# 100 * (31 - 6.1) / 31 ≈ 80.3%
Question

But... why we use avail memory instead of free memory?

In Linux, free memory (0.3-0.4 GB in our case) is just the unused RAM, which looks tiny because the system uses spare memory for cache (6.4 GB) to boost performance. But available memory (6.1 GB) is smarter: it counts both free RAM and cache that can be reused by apps, giving a true picture of what’s usable.

3. Setup Grafana

Please access grafana on http://localhost:3000 and login with username = adminuser and password=admin123. We setup this on docker-compose.monitoring.yml file in Environment section.
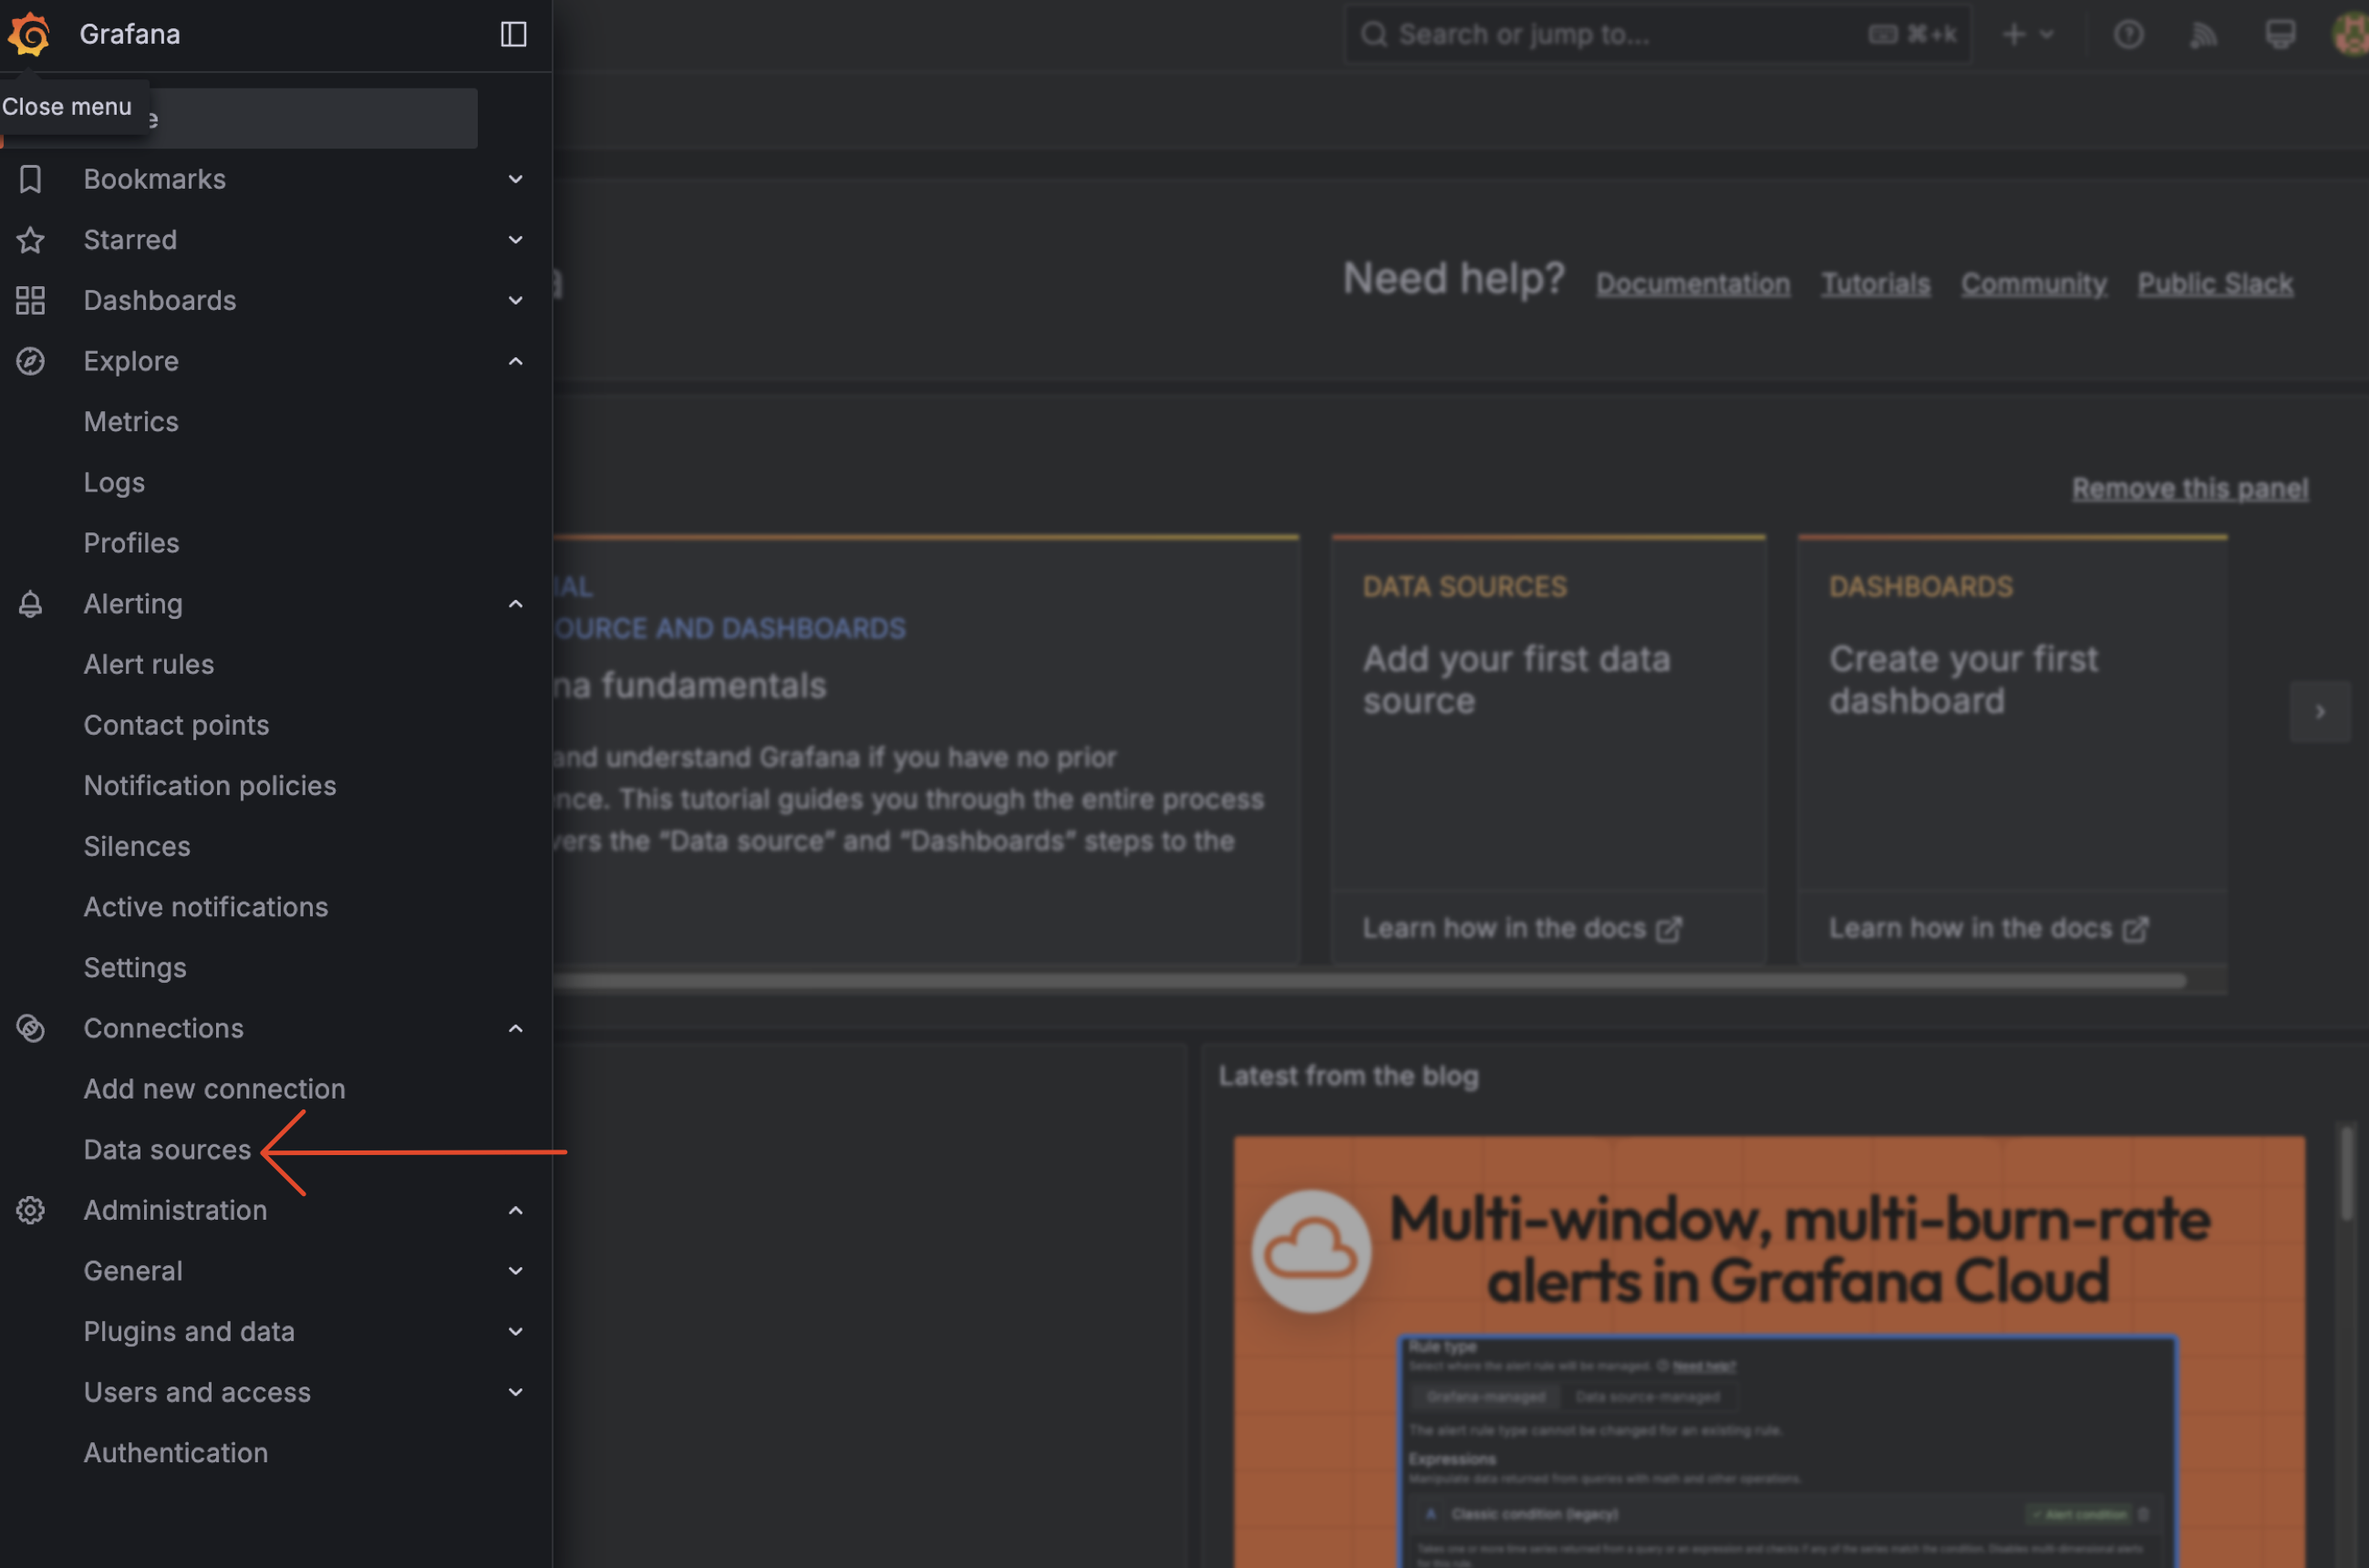
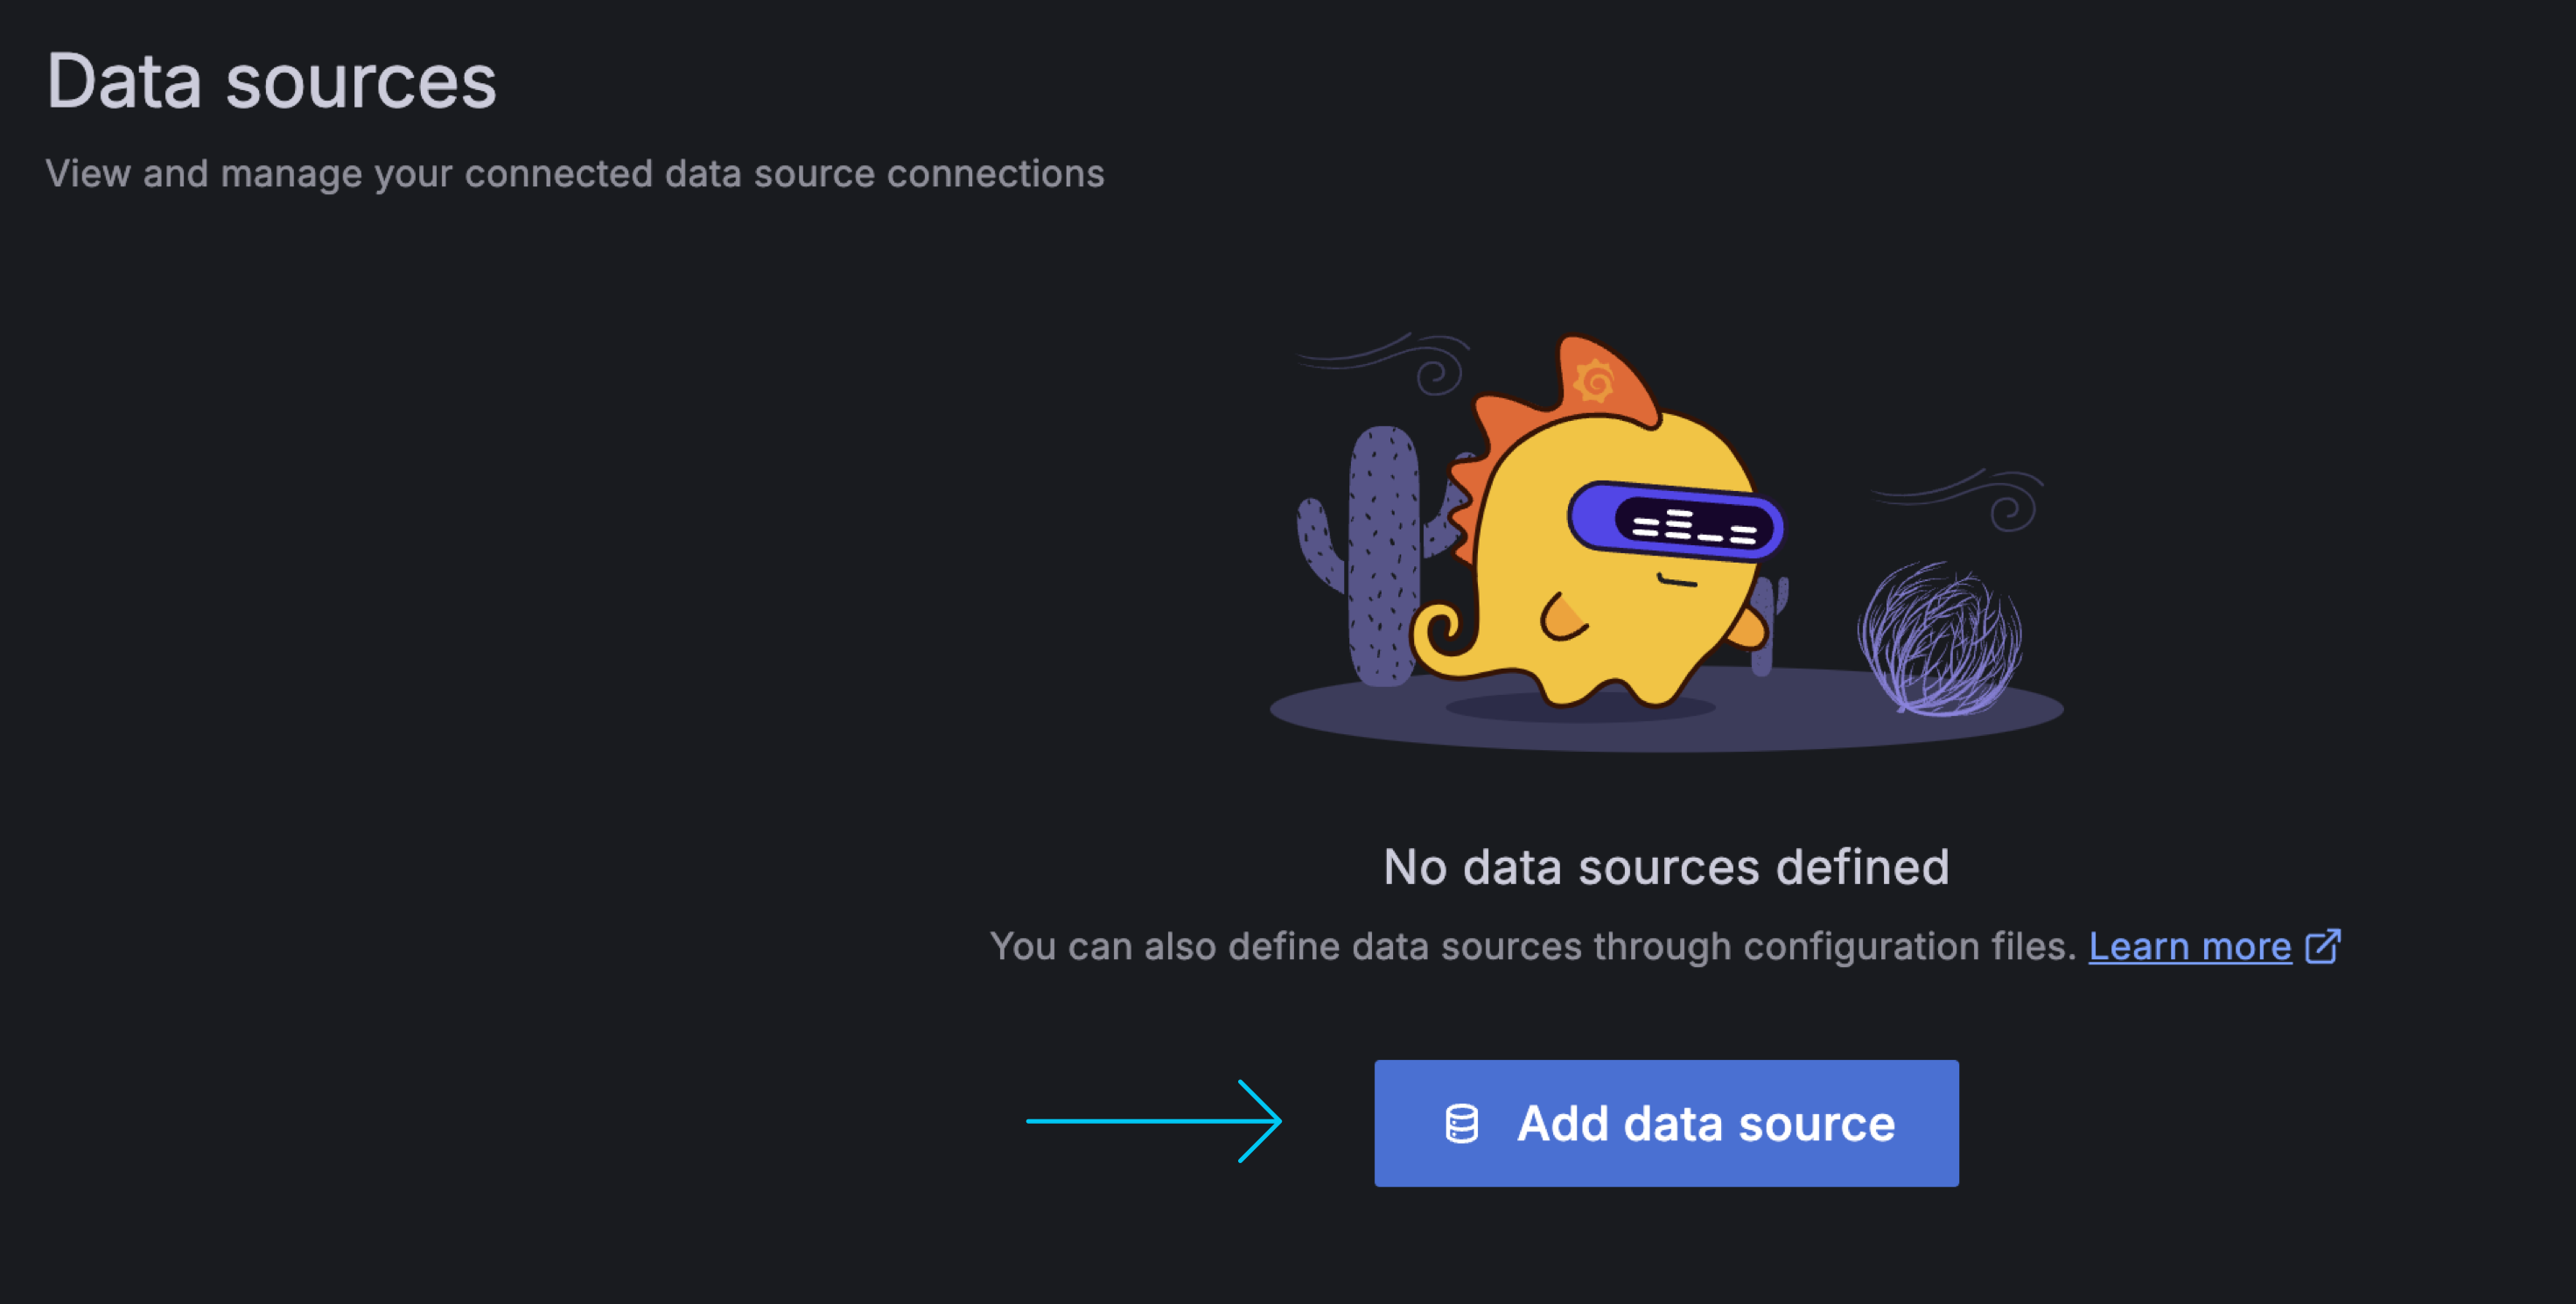
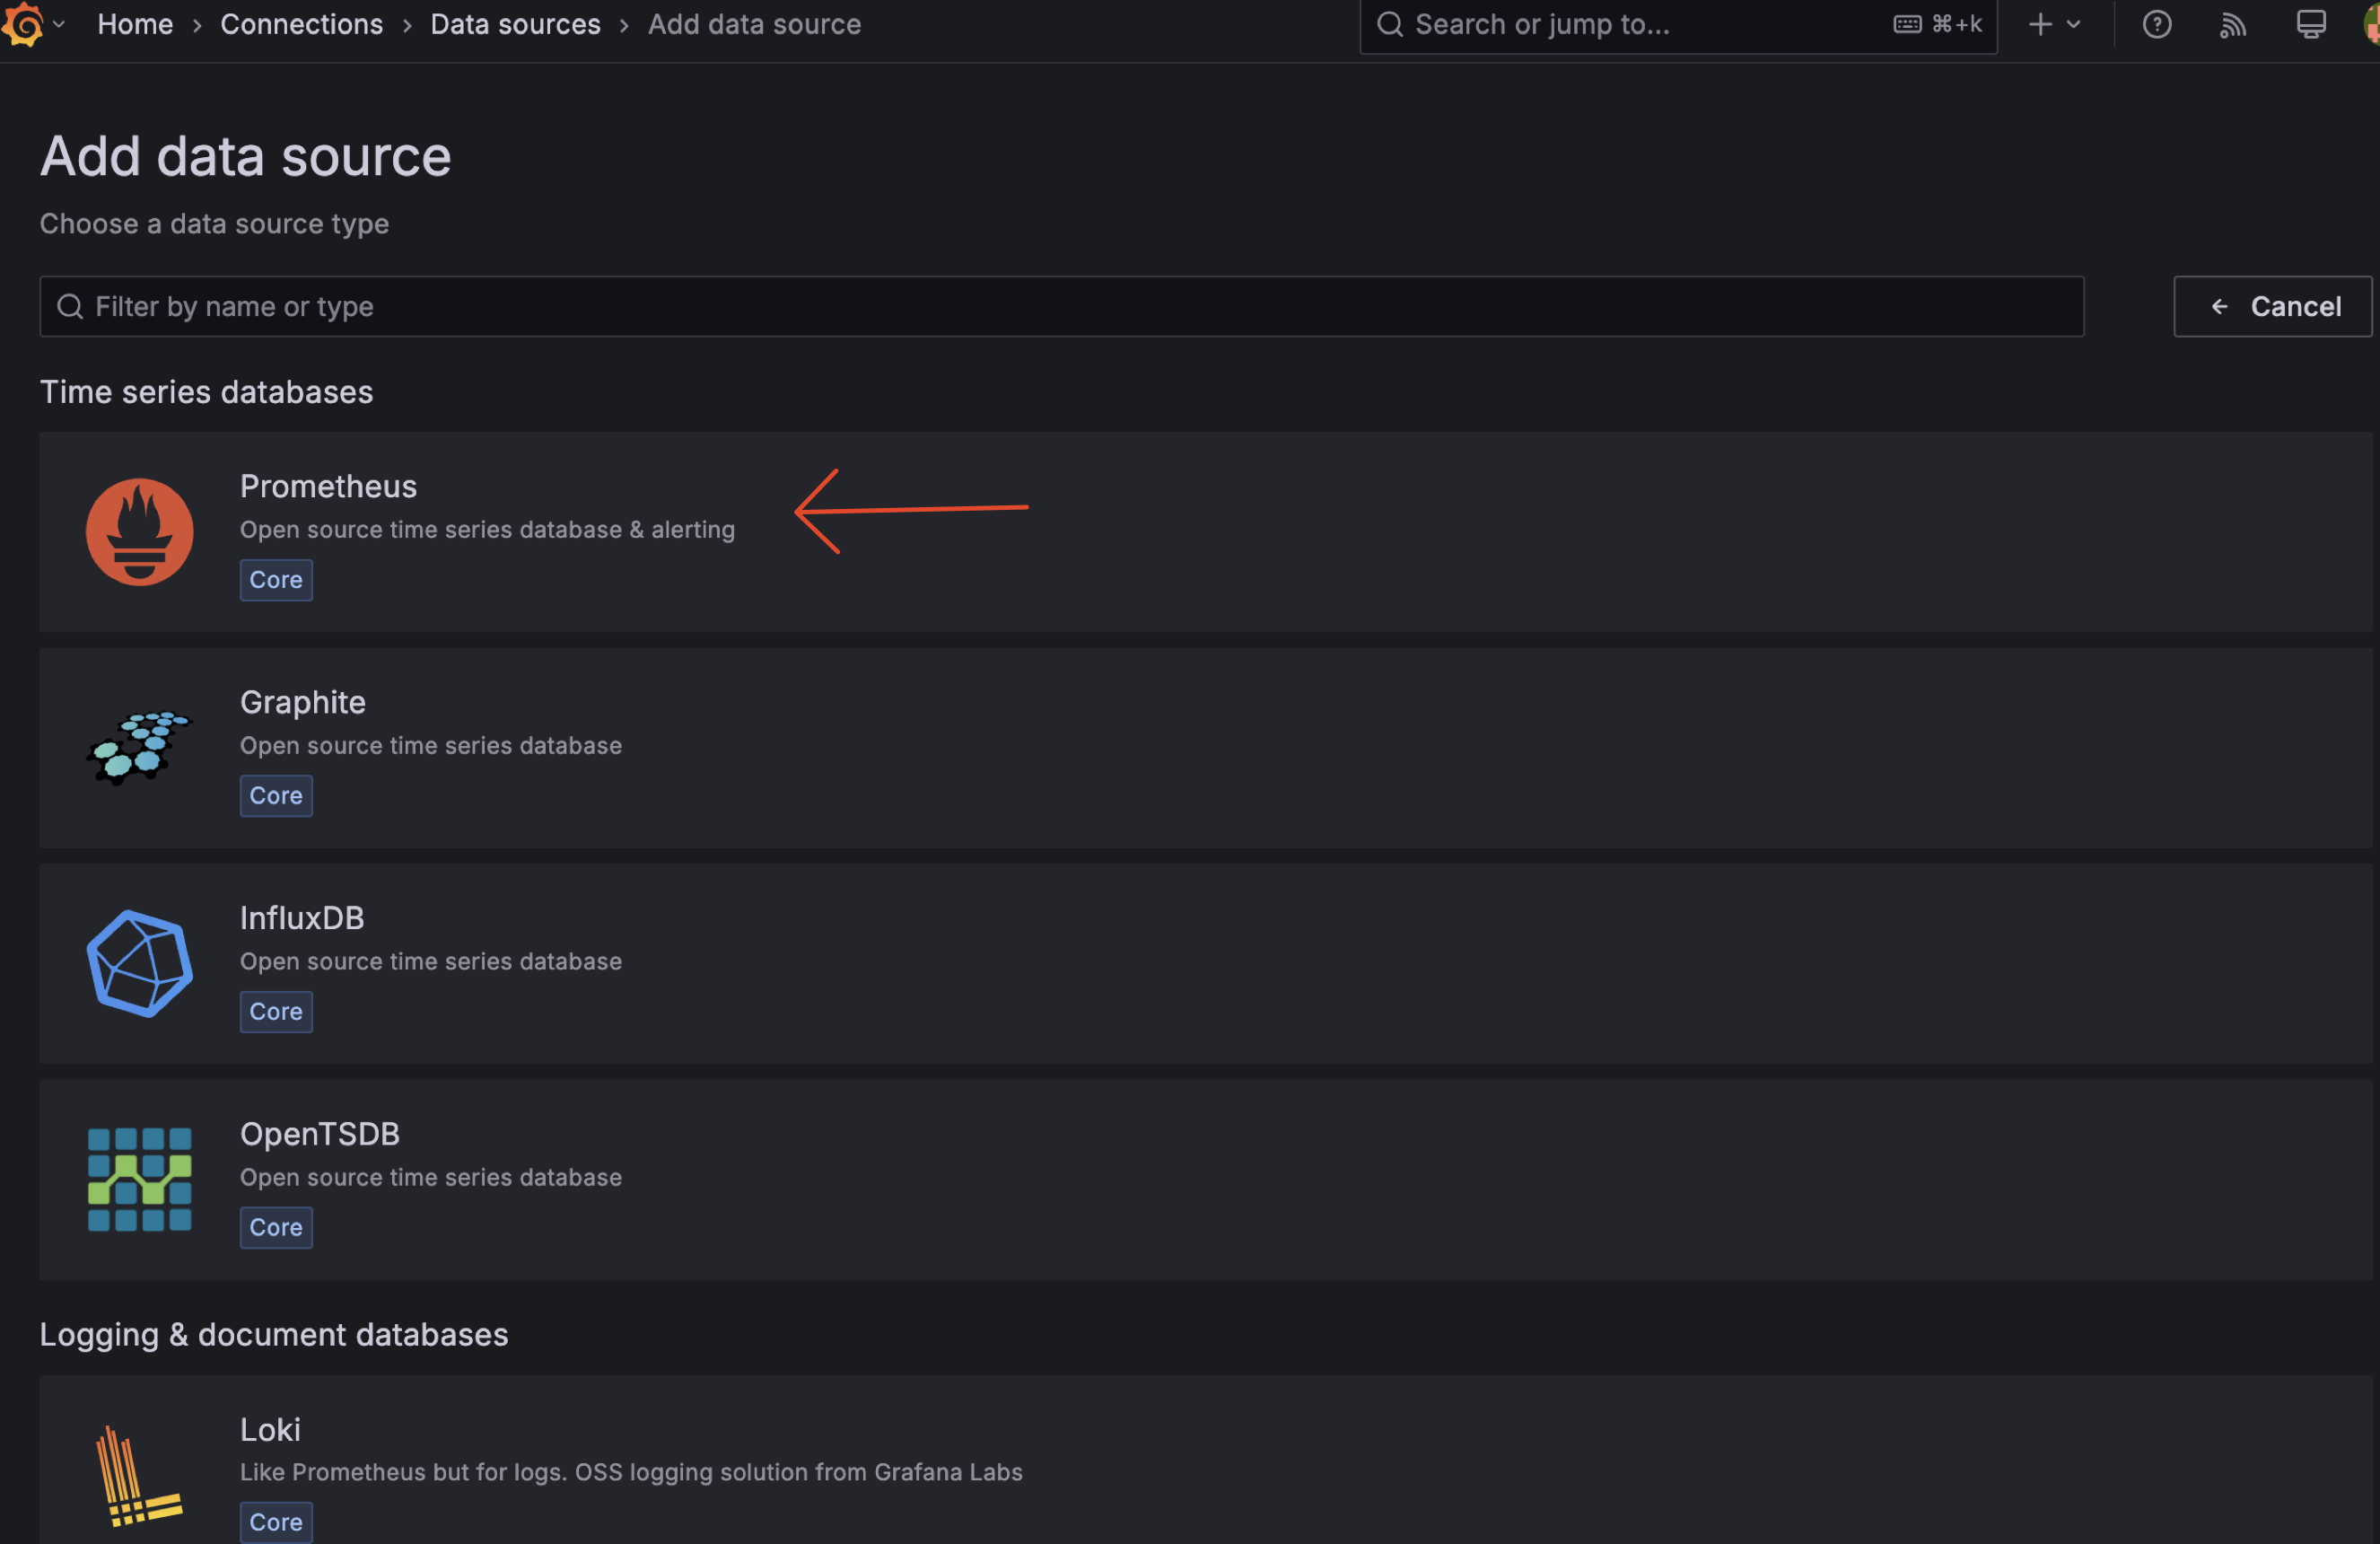
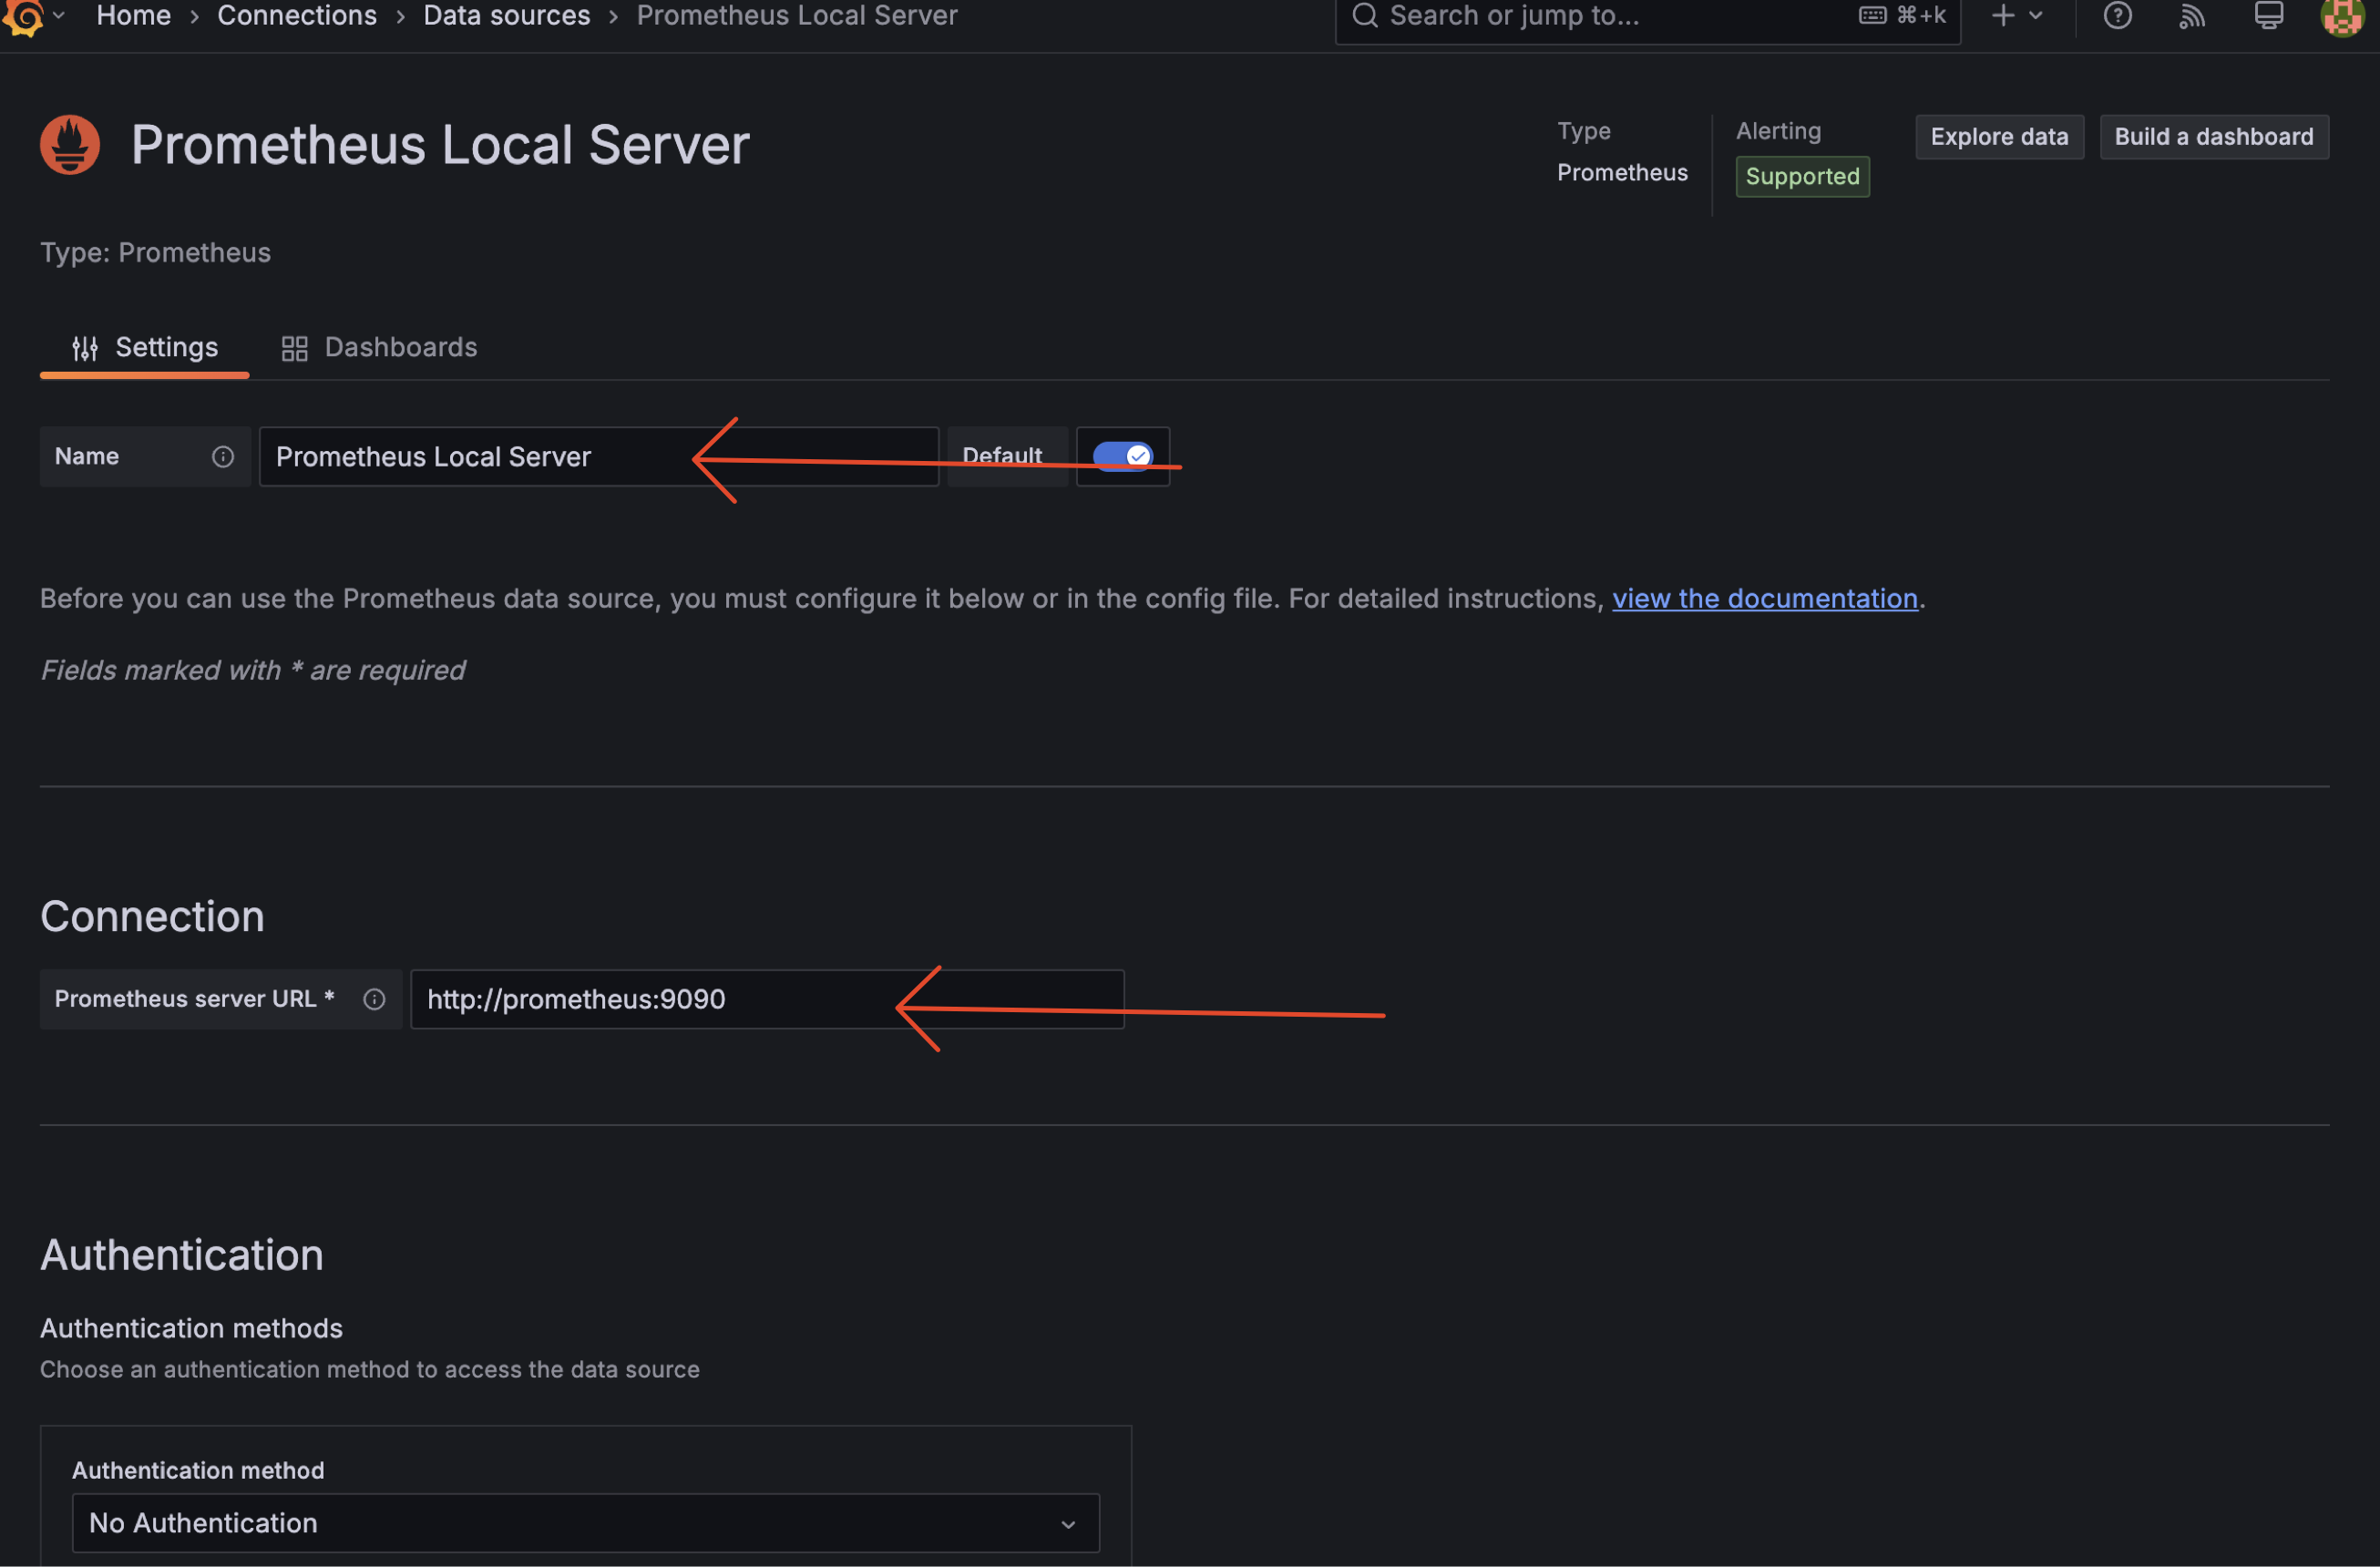
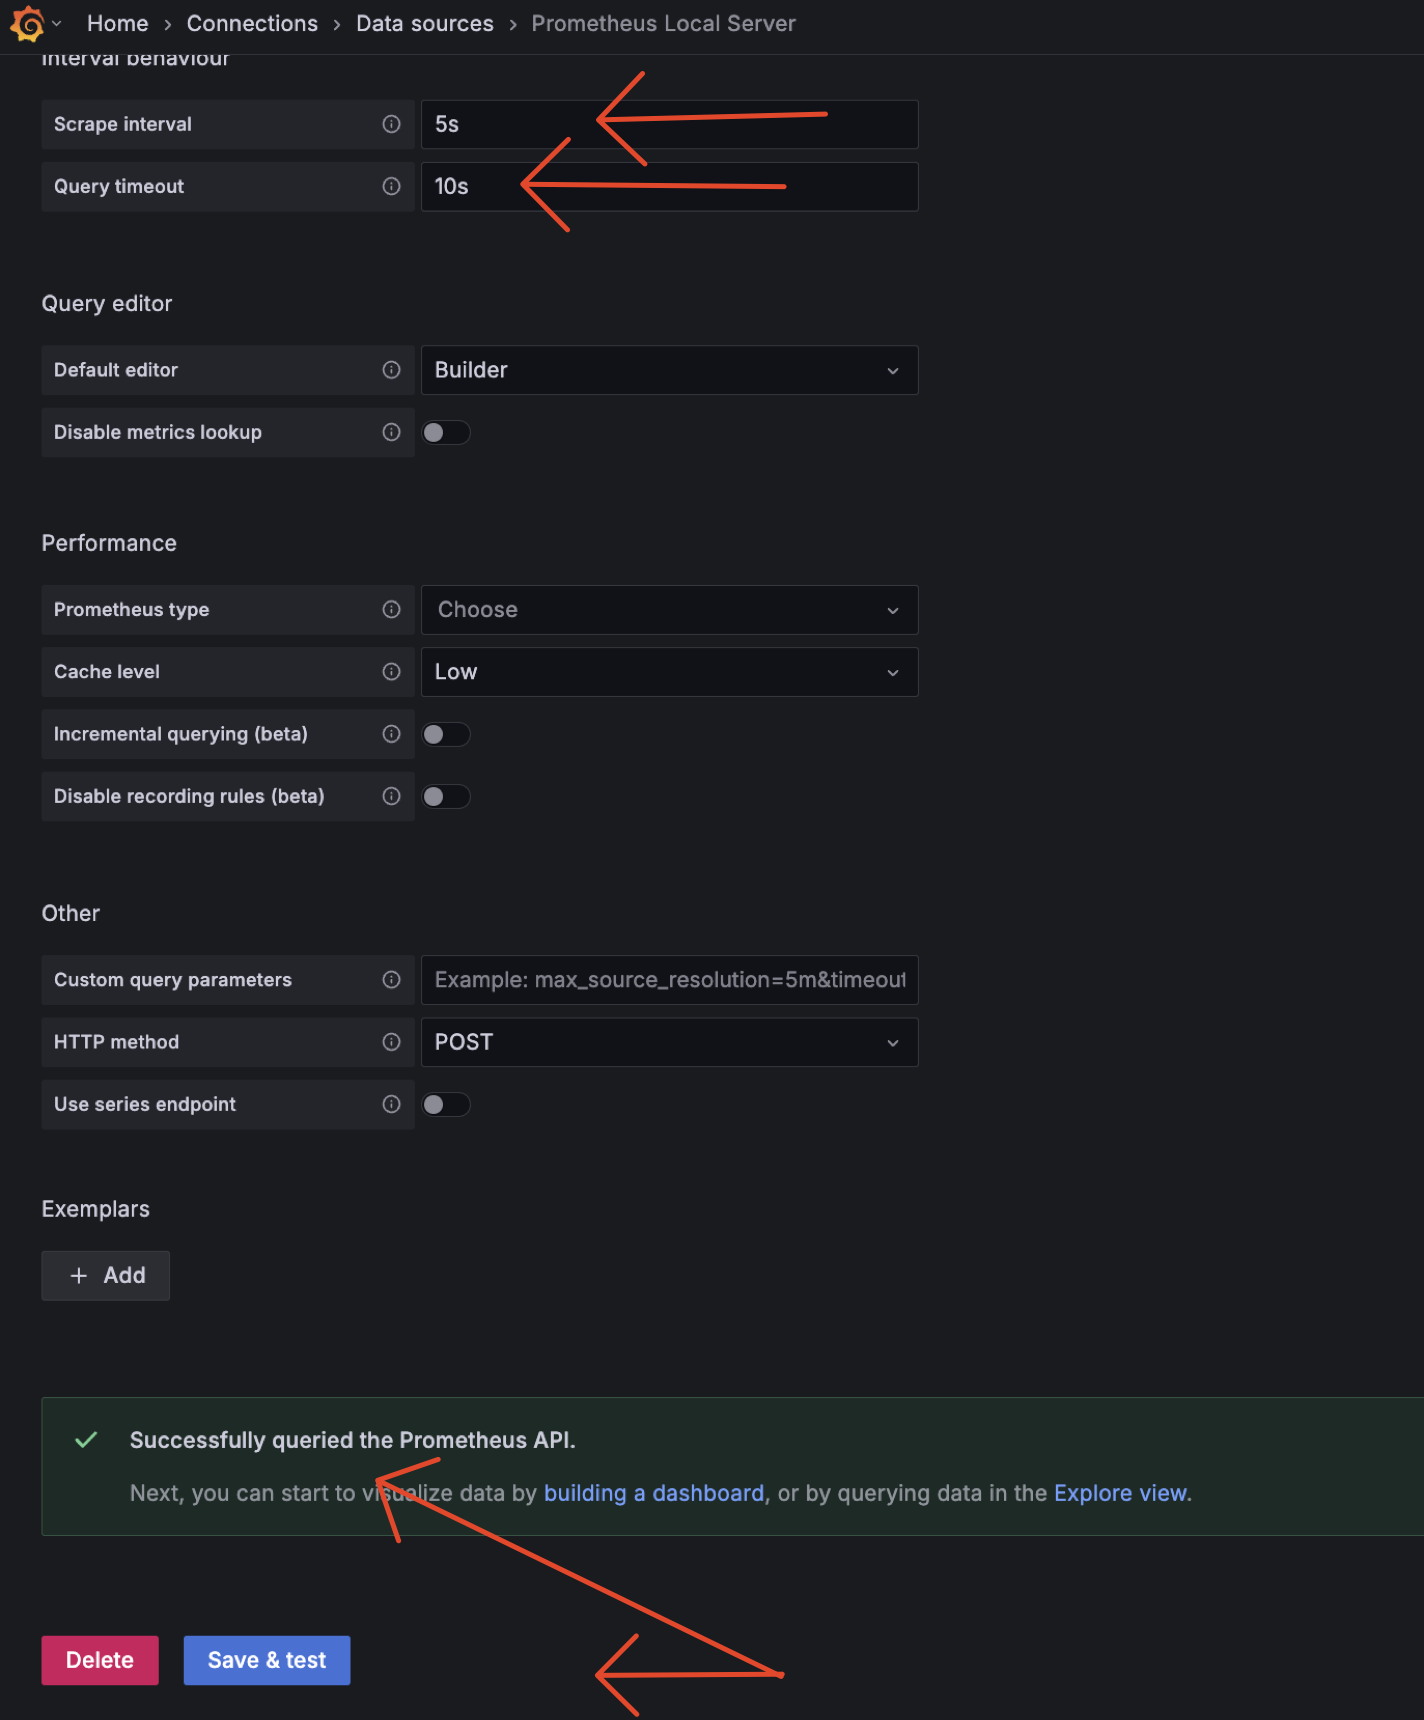
3.1 Add Datasource

Step Add Datasource

add-datasource add-datasource add-datasource add-datasource add-datasource

3.2 Add Dashboard

3.2.1 Create Custom Dashboard

Create a custom dashboard for monitoring cpu and memory usage. Why we need this? becuase sometime we need to create a custom dashboard for our needs. For example, in this case, we need to monitor cpu and memory usage.

Step Create Custom Dashboard
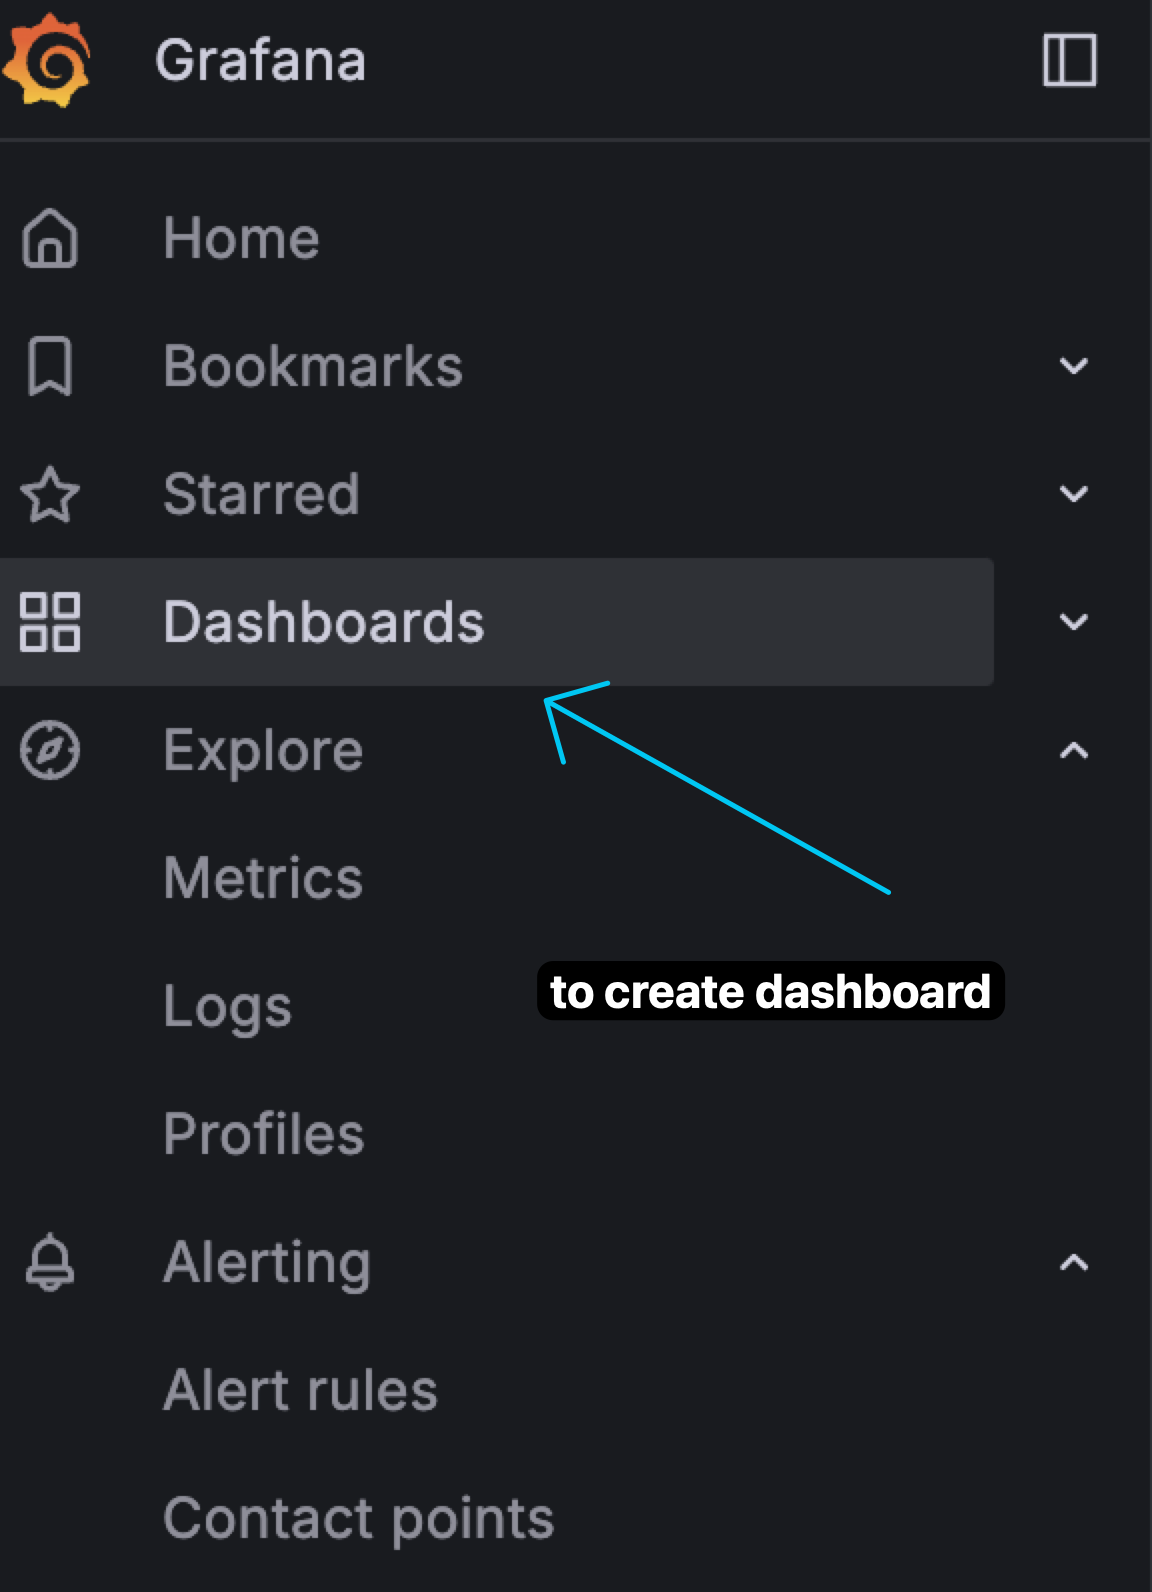
  1. Go to Grafana and go this menu to create a new dashboard.
    add-datasource

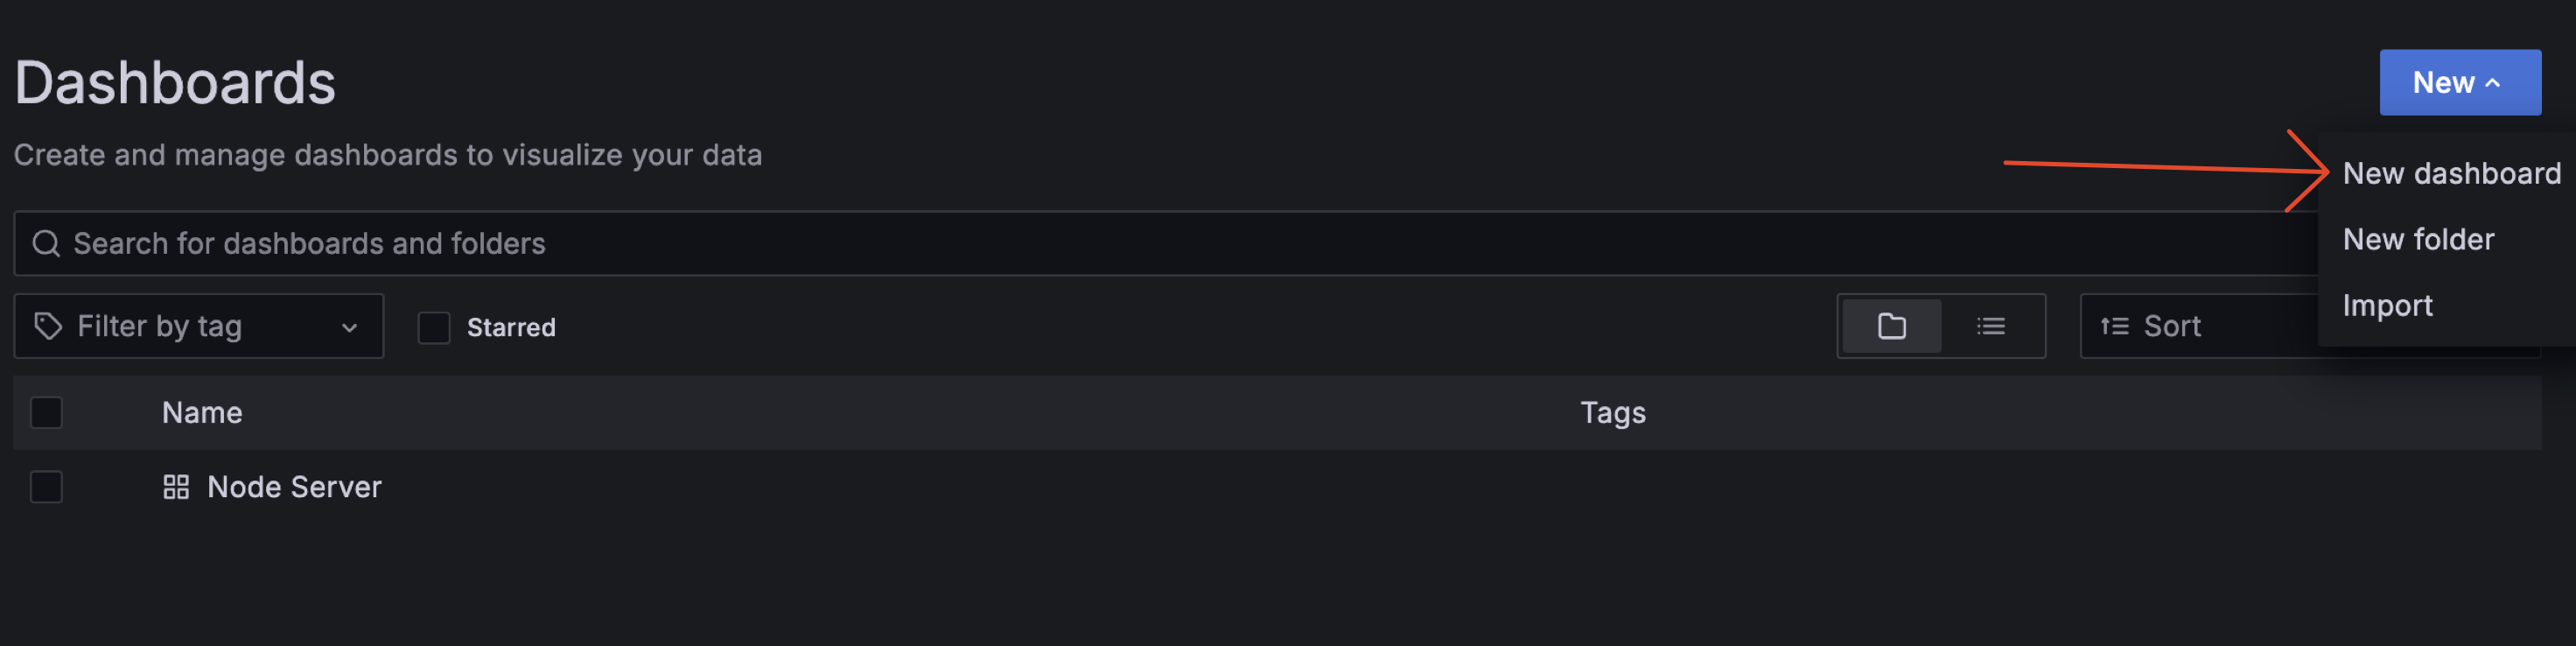
  2. Create a new dashboard by clicking on the "New" button and selecting "New Dashboard". add-datasource

  3. Add by clicking on "Add" -> "Vizualization". add-datasource

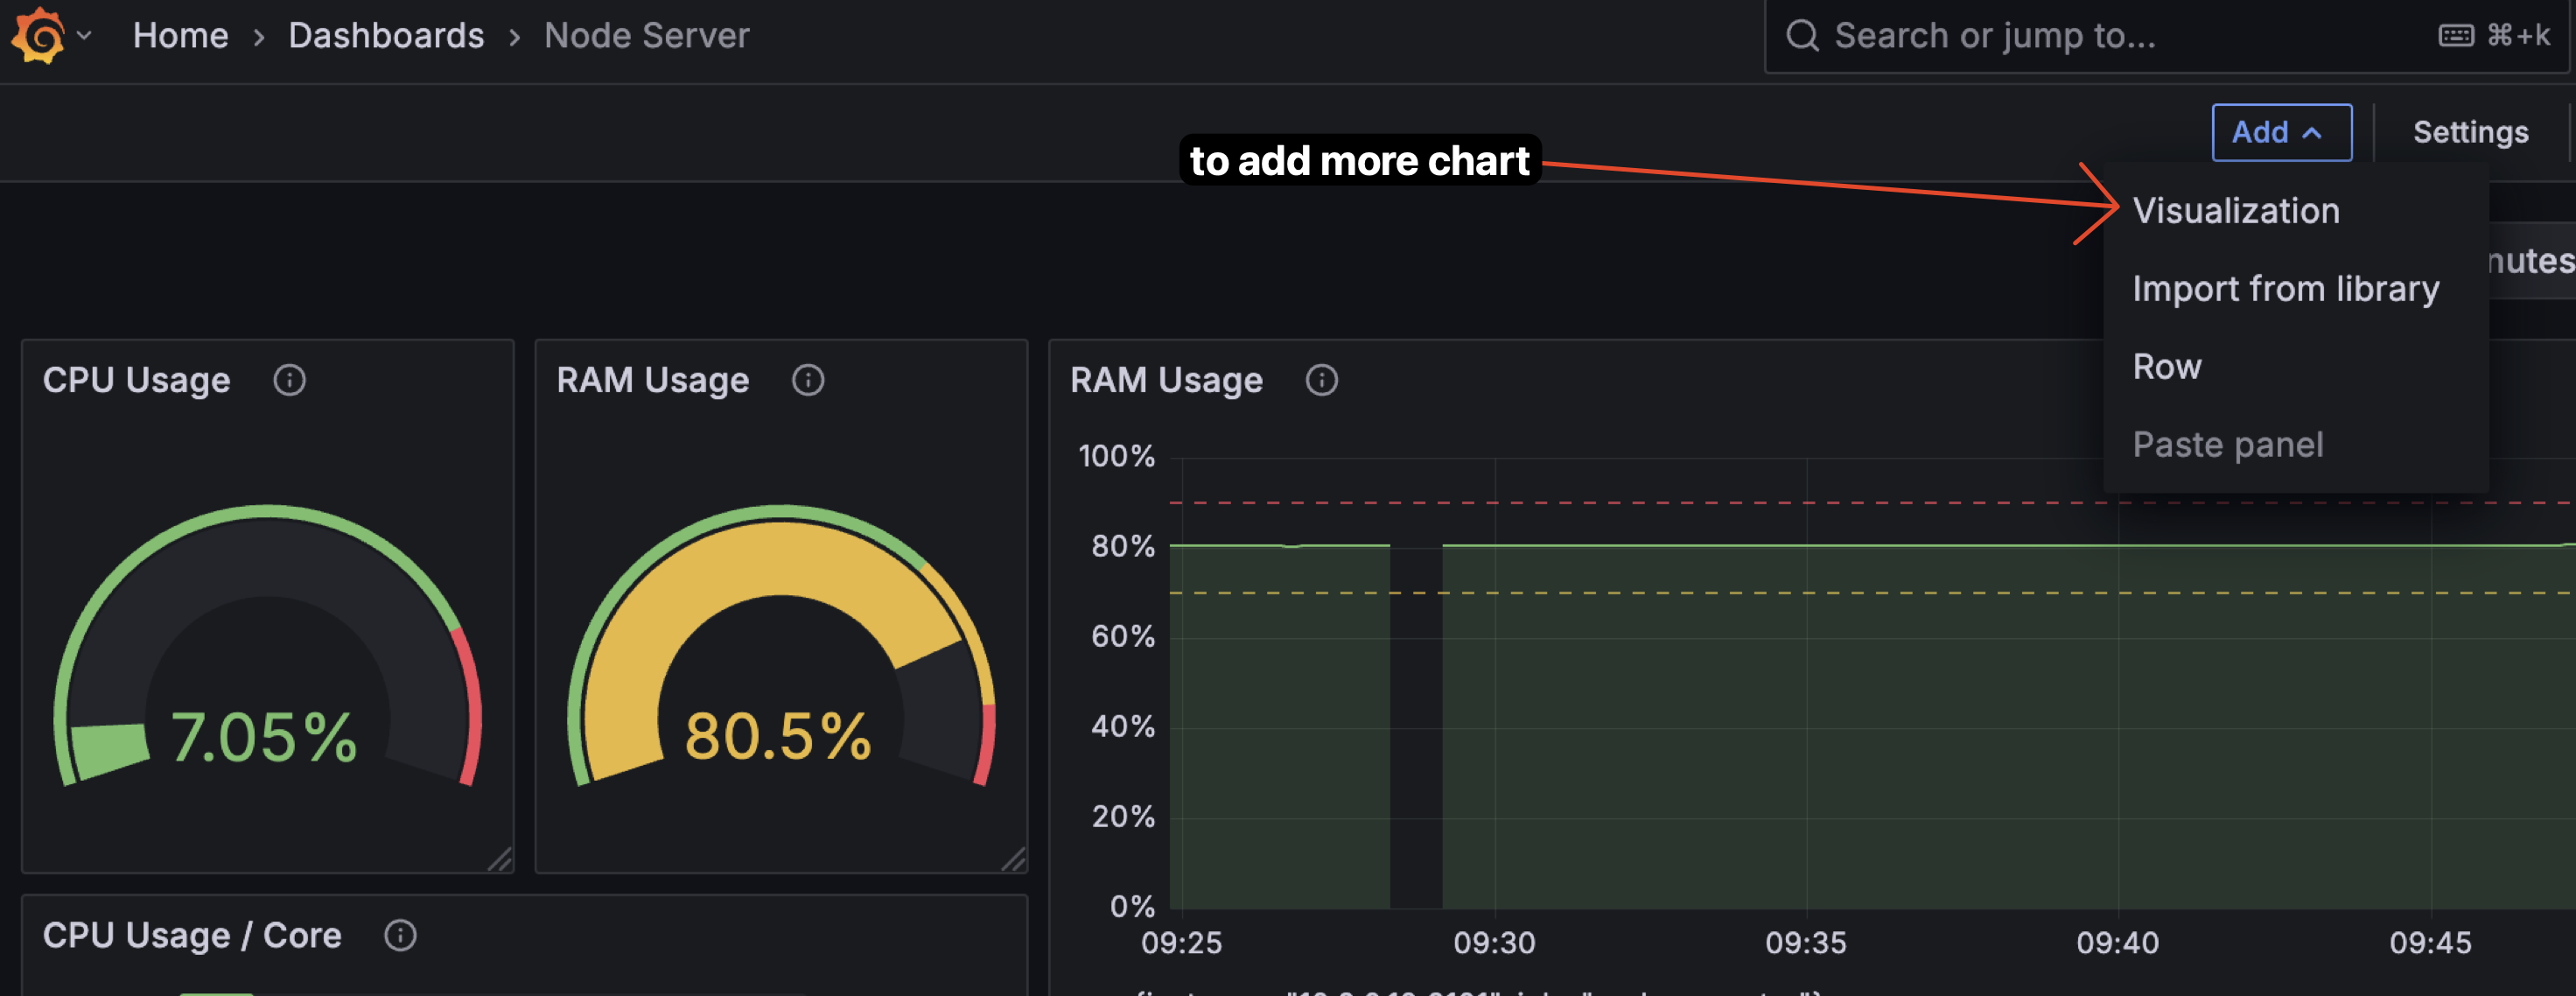
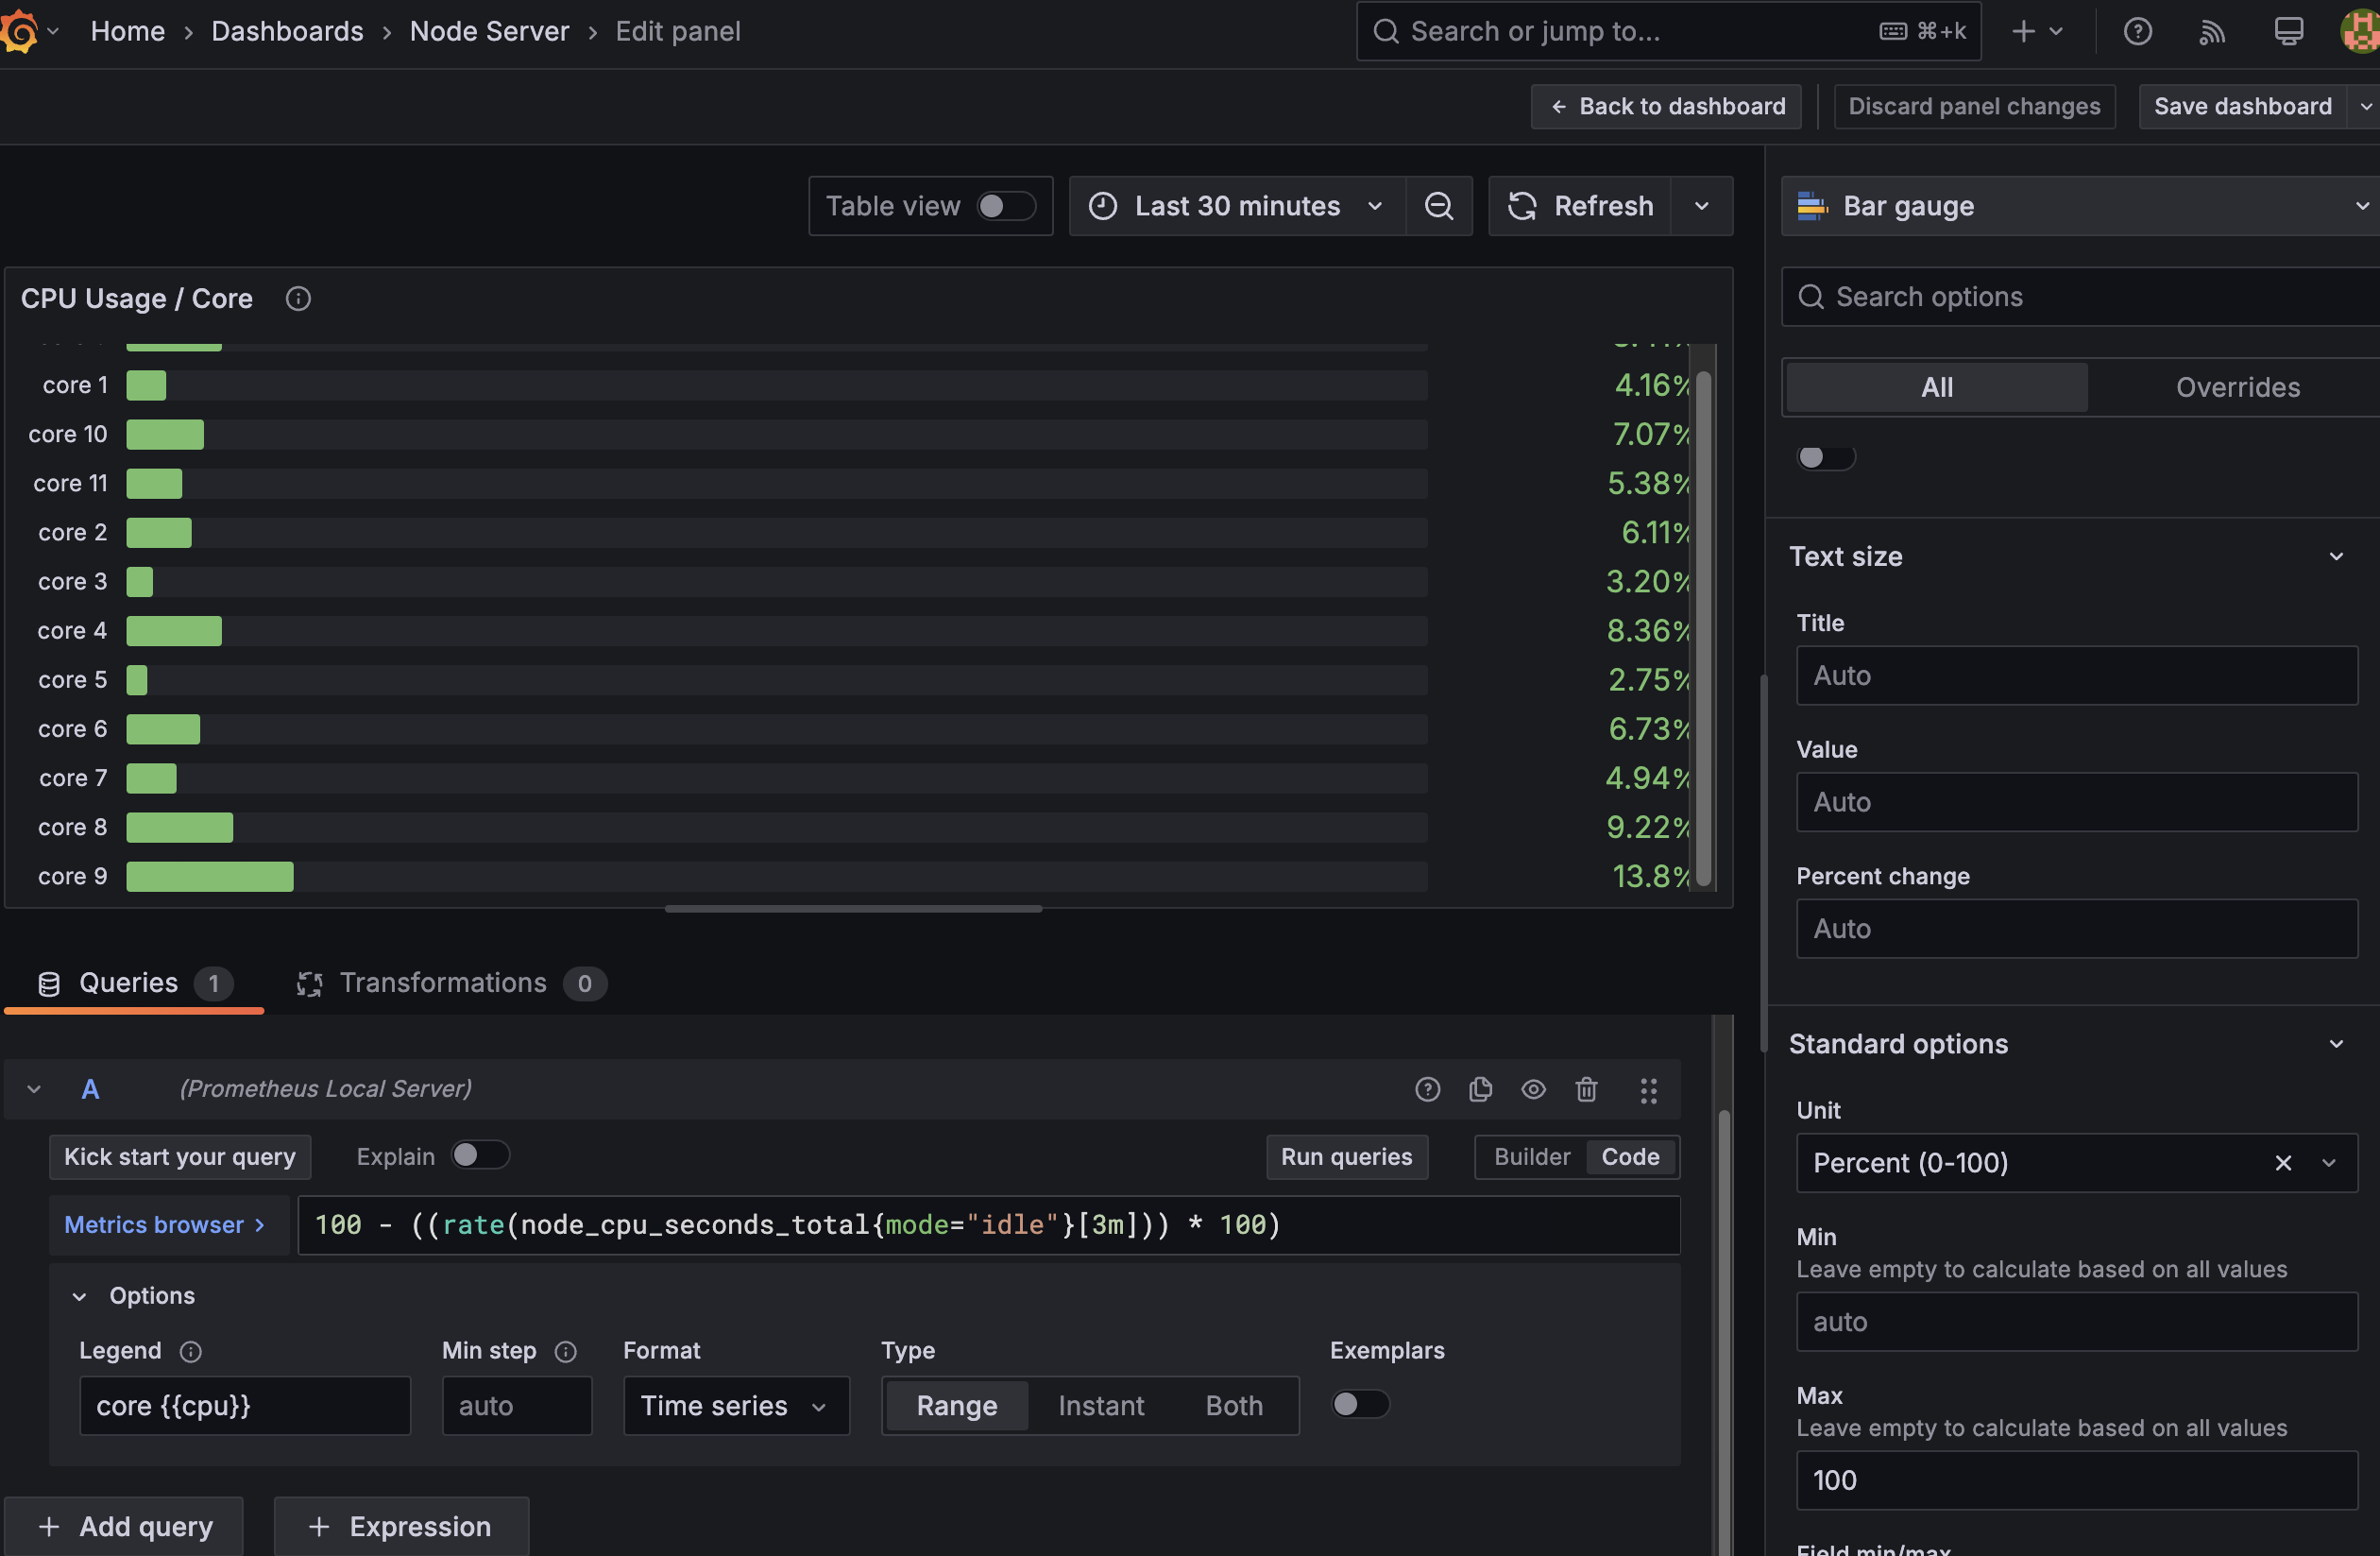
  4. Here i add new panel for "CPU core usage". So much configuration here, but you can just follow the image. I use Horizontal bar gauge for this panel. With setting like this:
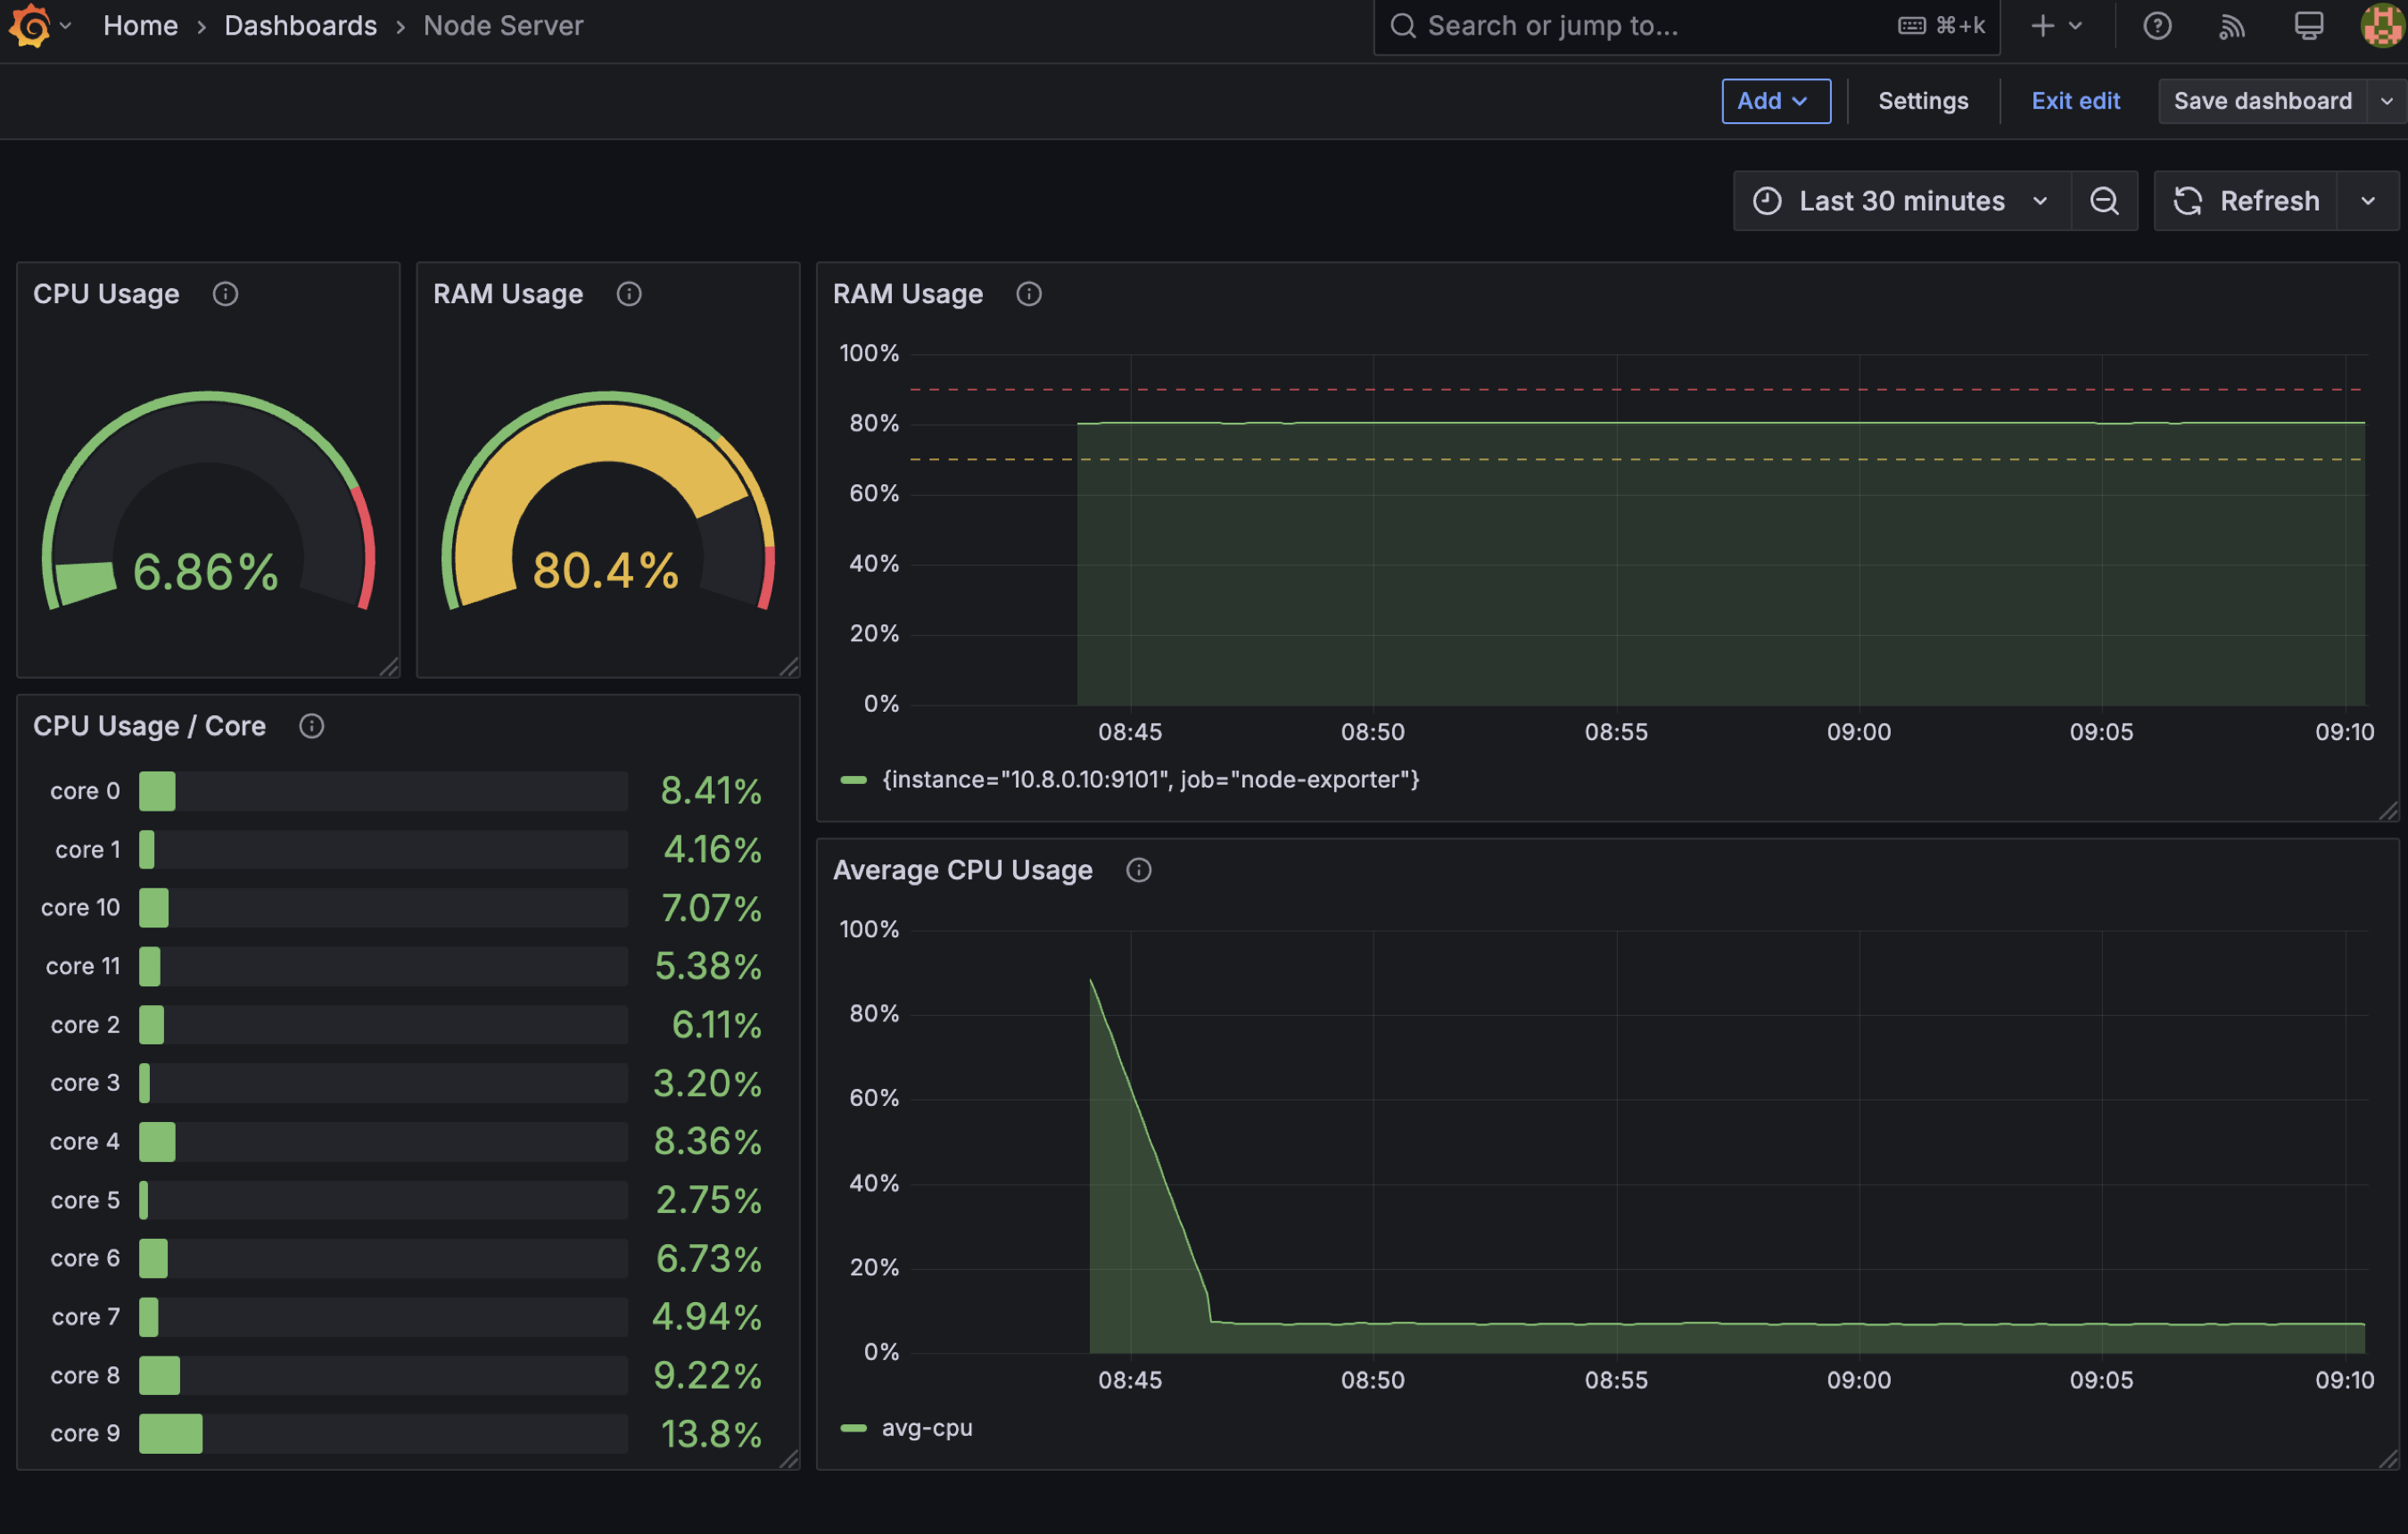
 add-datasource

  5. This is the result: add-datasource

if you want to use my template, you can use this json below. Copy this json and import to grafana.

Custom Dashboard JSON
template.json
  1
  2
  3
  4
  5
  6
  7
  8
  9
 10
 11
 12
 13
 14
 15
 16
 17
 18
 19
 20
 21
 22
 23
 24
 25
 26
 27
 28
 29
 30
 31
 32
 33
 34
 35
 36
 37
 38
 39
 40
 41
 42
 43
 44
 45
 46
 47
 48
 49
 50
 51
 52
 53
 54
 55
 56
 57
 58
 59
 60
 61
 62
 63
 64
 65
 66
 67
 68
 69
 70
 71
 72
 73
 74
 75
 76
 77
 78
 79
 80
 81
 82
 83
 84
 85
 86
 87
 88
 89
 90
 91
 92
 93
 94
 95
 96
 97
 98
 99
100
101
102
103
104
105
106
107
108
109
110
111
112
113
114
115
116
117
118
119
120
121
122
123
124
125
126
127
128
129
130
131
132
133
134
135
136
137
138
139
140
141
142
143
144
145
146
147
148
149
150
151
152
153
154
155
156
157
158
159
160
161
162
163
164
165
166
167
168
169
170
171
172
173
174
175
176
177
178
179
180
181
182
183
184
185
186
187
188
189
190
191
192
193
194
195
196
197
198
199
200
201
202
203
204
205
206
207
208
209
210
211
212
213
214
215
216
217
218
219
220
221
222
223
224
225
226
227
228
229
230
231
232
233
234
235
236
237
238
239
240
241
242
243
244
245
246
247
248
249
250
251
252
253
254
255
256
257
258
259
260
261
262
263
264
265
266
267
268
269
270
271
272
273
274
275
276
277
278
279
280
281
282
283
284
285
286
287
288
289
290
291
292
293
294
295
296
297
298
299
300
301
302
303
304
305
306
307
308
309
310
311
312
313
314
315
316
317
318
319
320
321
322
323
324
325
326
327
328
329
330
331
332
333
334
335
336
337
338
339
340
341
342
343
344
345
346
347
348
349
350
351
352
353
354
355
356
357
358
359
360
361
362
363
364
365
366
367
368
369
370
371
372
373
374
375
376
377
378
379
380
381
382
383
384
385
386
387
388
389
390
391
392
393
394
395
396
397
398
399
400
401
402
403
404
405
406
407
408
409
410
411
412
413
414
415
416
417
418
419
420
421
422
423
424
425
426
427
428
429
430
431
432
433
434
435
436
437
438
439
440
441
442
443
444
445
446
447
448
449
450
451
452
453
454
455
456
457
458
459
460
461
462
463
464
465
466
467
468
469
470
471
{
    "annotations": {
        "list": [
            {
                "builtIn": 1,
                "datasource": {
                "type": "grafana",
                "uid": "-- Grafana --"
                },
                "enable": true,
                "hide": true,
                "iconColor": "rgba(0, 211, 255, 1)",
                "name": "Annotations & Alerts",
                "type": "dashboard"
            }
            ]
        },
        "editable": true,
        "fiscalYearStartMonth": 0,
        "graphTooltip": 0,
        "id": 1,
        "links": [],
        "panels": [
            {
            "datasource": {
                "type": "prometheus",
                "uid": "ceeoh02726i9sa"
            },
            "description": "this tracking cpu usage",
            "fieldConfig": {
                "defaults": {
                "color": {
                    "mode": "thresholds"
                },
                "mappings": [],
                "max": 100,
                "thresholds": {
                    "mode": "absolute",
                    "steps": [
                    {
                        "color": "green",
                        "value": null
                    },
                    {
                        "color": "red",
                        "value": 80
                    }
                    ]
                },
                "unit": "percent"
                },
                "overrides": []
            },
            "gridPos": {
                "h": 6,
                "w": 4,
                "x": 0,
                "y": 0
            },
            "id": 2,
            "options": {
                "minVizHeight": 75,
                "minVizWidth": 75,
                "orientation": "horizontal",
                "reduceOptions": {
                "calcs": [
                    "lastNotNull"
                ],
                "fields": "",
                "values": false
                },
                "showThresholdLabels": false,
                "showThresholdMarkers": true,
                "sizing": "auto"
            },
            "pluginVersion": "11.5.2",
            "targets": [
                {
                "datasource": {
                    "type": "prometheus",
                    "uid": "ceeoh02726i9sa"
                },
                "editorMode": "code",
                "expr": "100 - (avg(rate(node_cpu_seconds_total{mode=\"idle\"}[3m])) * 100)",
                "legendFormat": "__auto",
                "range": true,
                "refId": "A"
                }
            ],
            "title": "CPU Usage",
            "type": "gauge"
            },
            {
            "datasource": {
                "type": "prometheus",
                "uid": "ceeoh02726i9sa"
            },
            "description": "this tracking cpu usage",
            "fieldConfig": {
                "defaults": {
                "color": {
                    "mode": "thresholds"
                },
                "mappings": [],
                "max": 100,
                "thresholds": {
                    "mode": "absolute",
                    "steps": [
                    {
                        "color": "green",
                        "value": null
                    },
                    {
                        "color": "#EAB839",
                        "value": 70
                    },
                    {
                        "color": "red",
                        "value": 90
                    }
                    ]
                },
                "unit": "percent"
                },
                "overrides": []
            },
            "gridPos": {
                "h": 6,
                "w": 4,
                "x": 4,
                "y": 0
            },
            "id": 3,
            "options": {
                "minVizHeight": 75,
                "minVizWidth": 75,
                "orientation": "horizontal",
                "reduceOptions": {
                "calcs": [
                    "lastNotNull"
                ],
                "fields": "",
                "values": false
                },
                "showThresholdLabels": false,
                "showThresholdMarkers": true,
                "sizing": "auto"
            },
            "pluginVersion": "11.5.2",
            "targets": [
                {
                "datasource": {
                    "type": "prometheus",
                    "uid": "ceeoh02726i9sa"
                },
                "editorMode": "code",
                "expr": "100 - (100 * (node_memory_MemAvailable_bytes / node_memory_MemTotal_bytes))",
                "legendFormat": "__auto",
                "range": true,
                "refId": "A"
                }
            ],
            "title": "RAM Usage",
            "type": "gauge"
            },
            {
            "datasource": {
                "type": "prometheus",
                "uid": "ceeoh02726i9sa"
            },
            "description": "this tracking ram usage",
            "fieldConfig": {
                "defaults": {
                "color": {
                    "mode": "palette-classic"
                },
                "custom": {
                    "axisBorderShow": false,
                    "axisCenteredZero": false,
                    "axisColorMode": "text",
                    "axisLabel": "",
                    "axisPlacement": "auto",
                    "barAlignment": 0,
                    "barWidthFactor": 0.6,
                    "drawStyle": "line",
                    "fillOpacity": 16,
                    "gradientMode": "none",
                    "hideFrom": {
                    "legend": false,
                    "tooltip": false,
                    "viz": false
                    },
                    "insertNulls": false,
                    "lineInterpolation": "linear",
                    "lineStyle": {
                    "fill": "solid"
                    },
                    "lineWidth": 1,
                    "pointSize": 5,
                    "scaleDistribution": {
                    "type": "linear"
                    },
                    "showPoints": "auto",
                    "spanNulls": false,
                    "stacking": {
                    "group": "A",
                    "mode": "none"
                    },
                    "thresholdsStyle": {
                    "mode": "dashed"
                    }
                },
                "mappings": [],
                "max": 100,
                "min": 0,
                "thresholds": {
                    "mode": "absolute",
                    "steps": [
                    {
                        "color": "green",
                        "value": null
                    },
                    {
                        "color": "#EAB839",
                        "value": 70
                    },
                    {
                        "color": "red",
                        "value": 90
                    }
                    ]
                },
                "unit": "percent"
                },
                "overrides": []
            },
            "gridPos": {
                "h": 8,
                "w": 16,
                "x": 8,
                "y": 0
            },
            "id": 5,
            "options": {
                "legend": {
                "calcs": [],
                "displayMode": "list",
                "placement": "bottom",
                "showLegend": true
                },
                "tooltip": {
                "hideZeros": false,
                "mode": "single",
                "sort": "none"
                }
            },
            "pluginVersion": "11.5.2",
            "targets": [
                {
                "datasource": {
                    "type": "prometheus",
                    "uid": "ceeoh02726i9sa"
                },
                "editorMode": "code",
                "expr": "100 - (100 * (node_memory_MemAvailable_bytes / node_memory_MemTotal_bytes))",
                "legendFormat": "__auto",
                "range": true,
                "refId": "A"
                }
            ],
            "title": "RAM Usage",
            "type": "timeseries"
            },
            {
            "datasource": {
                "type": "prometheus",
                "uid": "ceeoh02726i9sa"
            },
            "description": "this tracking cpu usage",
            "fieldConfig": {
                "defaults": {
                "color": {
                    "mode": "thresholds"
                },
                "mappings": [],
                "max": 100,
                "thresholds": {
                    "mode": "absolute",
                    "steps": [
                    {
                        "color": "green",
                        "value": null
                    },
                    {
                        "color": "red",
                        "value": 80
                    }
                    ]
                },
                "unit": "percent"
                },
                "overrides": []
            },
            "gridPos": {
                "h": 11,
                "w": 8,
                "x": 0,
                "y": 6
            },
            "id": 1,
            "options": {
                "displayMode": "gradient",
                "legend": {
                "calcs": [],
                "displayMode": "list",
                "placement": "bottom",
                "showLegend": false
                },
                "maxVizHeight": 300,
                "minVizHeight": 16,
                "minVizWidth": 8,
                "namePlacement": "auto",
                "orientation": "horizontal",
                "reduceOptions": {
                "calcs": [
                    "lastNotNull"
                ],
                "fields": "",
                "values": false
                },
                "showUnfilled": true,
                "sizing": "auto",
                "valueMode": "color"
            },
            "pluginVersion": "11.5.2",
            "targets": [
                {
                "datasource": {
                    "type": "prometheus",
                    "uid": "ceeoh02726i9sa"
                },
                "editorMode": "code",
                "expr": "100 - ((rate(node_cpu_seconds_total{mode=\"idle\"}[3m])) * 100)",
                "legendFormat": "core {{cpu}}",
                "range": true,
                "refId": "A"
                }
            ],
            "title": "CPU Usage / Core",
            "type": "bargauge"
            },
            {
            "datasource": {
                "type": "prometheus",
                "uid": "ceeoh02726i9sa"
            },
            "description": "this tracking cpu usage",
            "fieldConfig": {
                "defaults": {
                "color": {
                    "mode": "palette-classic"
                },
                "custom": {
                    "axisBorderShow": false,
                    "axisCenteredZero": false,
                    "axisColorMode": "text",
                    "axisLabel": "",
                    "axisPlacement": "auto",
                    "barAlignment": 0,
                    "barWidthFactor": 0.6,
                    "drawStyle": "line",
                    "fillOpacity": 27,
                    "gradientMode": "none",
                    "hideFrom": {
                    "legend": false,
                    "tooltip": false,
                    "viz": false
                    },
                    "insertNulls": false,
                    "lineInterpolation": "linear",
                    "lineWidth": 1,
                    "pointSize": 5,
                    "scaleDistribution": {
                    "type": "linear"
                    },
                    "showPoints": "auto",
                    "spanNulls": false,
                    "stacking": {
                    "group": "A",
                    "mode": "none"
                    },
                    "thresholdsStyle": {
                    "mode": "off"
                    }
                },
                "mappings": [],
                "max": 100,
                "min": 0,
                "thresholds": {
                    "mode": "absolute",
                    "steps": [
                    {
                        "color": "green",
                        "value": null
                    },
                    {
                        "color": "red",
                        "value": 80
                    }
                    ]
                },
                "unit": "percent"
                },
                "overrides": []
            },
            "gridPos": {
                "h": 9,
                "w": 16,
                "x": 8,
                "y": 8
            },
            "id": 4,
            "options": {
                "legend": {
                "calcs": [],
                "displayMode": "list",
                "placement": "bottom",
                "showLegend": true
                },
                "tooltip": {
                "hideZeros": false,
                "mode": "single",
                "sort": "none"
                }
            },
            "pluginVersion": "11.5.2",
            "targets": [
                {
                "datasource": {
                    "type": "prometheus",
                    "uid": "ceeoh02726i9sa"
                },
                "editorMode": "code",
                "expr": "100 - (avg(rate(node_cpu_seconds_total{mode=\"idle\"}[3m])) * 100)",
                "legendFormat": "avg-cpu",
                "range": true,
                "refId": "A"
                }
            ],
            "title": "Average CPU Usage",
            "type": "timeseries"
            }
        ],
        "preload": false,
        "refresh": "",
        "schemaVersion": 40,
        "tags": [],
        "templating": {
            "list": []
        },
        "time": {
            "from": "now-30m",
            "to": "now"
        },
        "timepicker": {},
        "timezone": "browser",
        "title": "Node Server",
        "uid": "ceeoiutz61e68c",
        "version": 8,
        "weekStart": ""
}

3.2.2 Create Dashboard by Import

or, alternatively, you can use others dashboard from grafana.com. Here we can use https://grafana.com/grafana/dashboards/1860-node-exporter-full/ for vizualization full node exporter.

Step Create Dashboard by Import
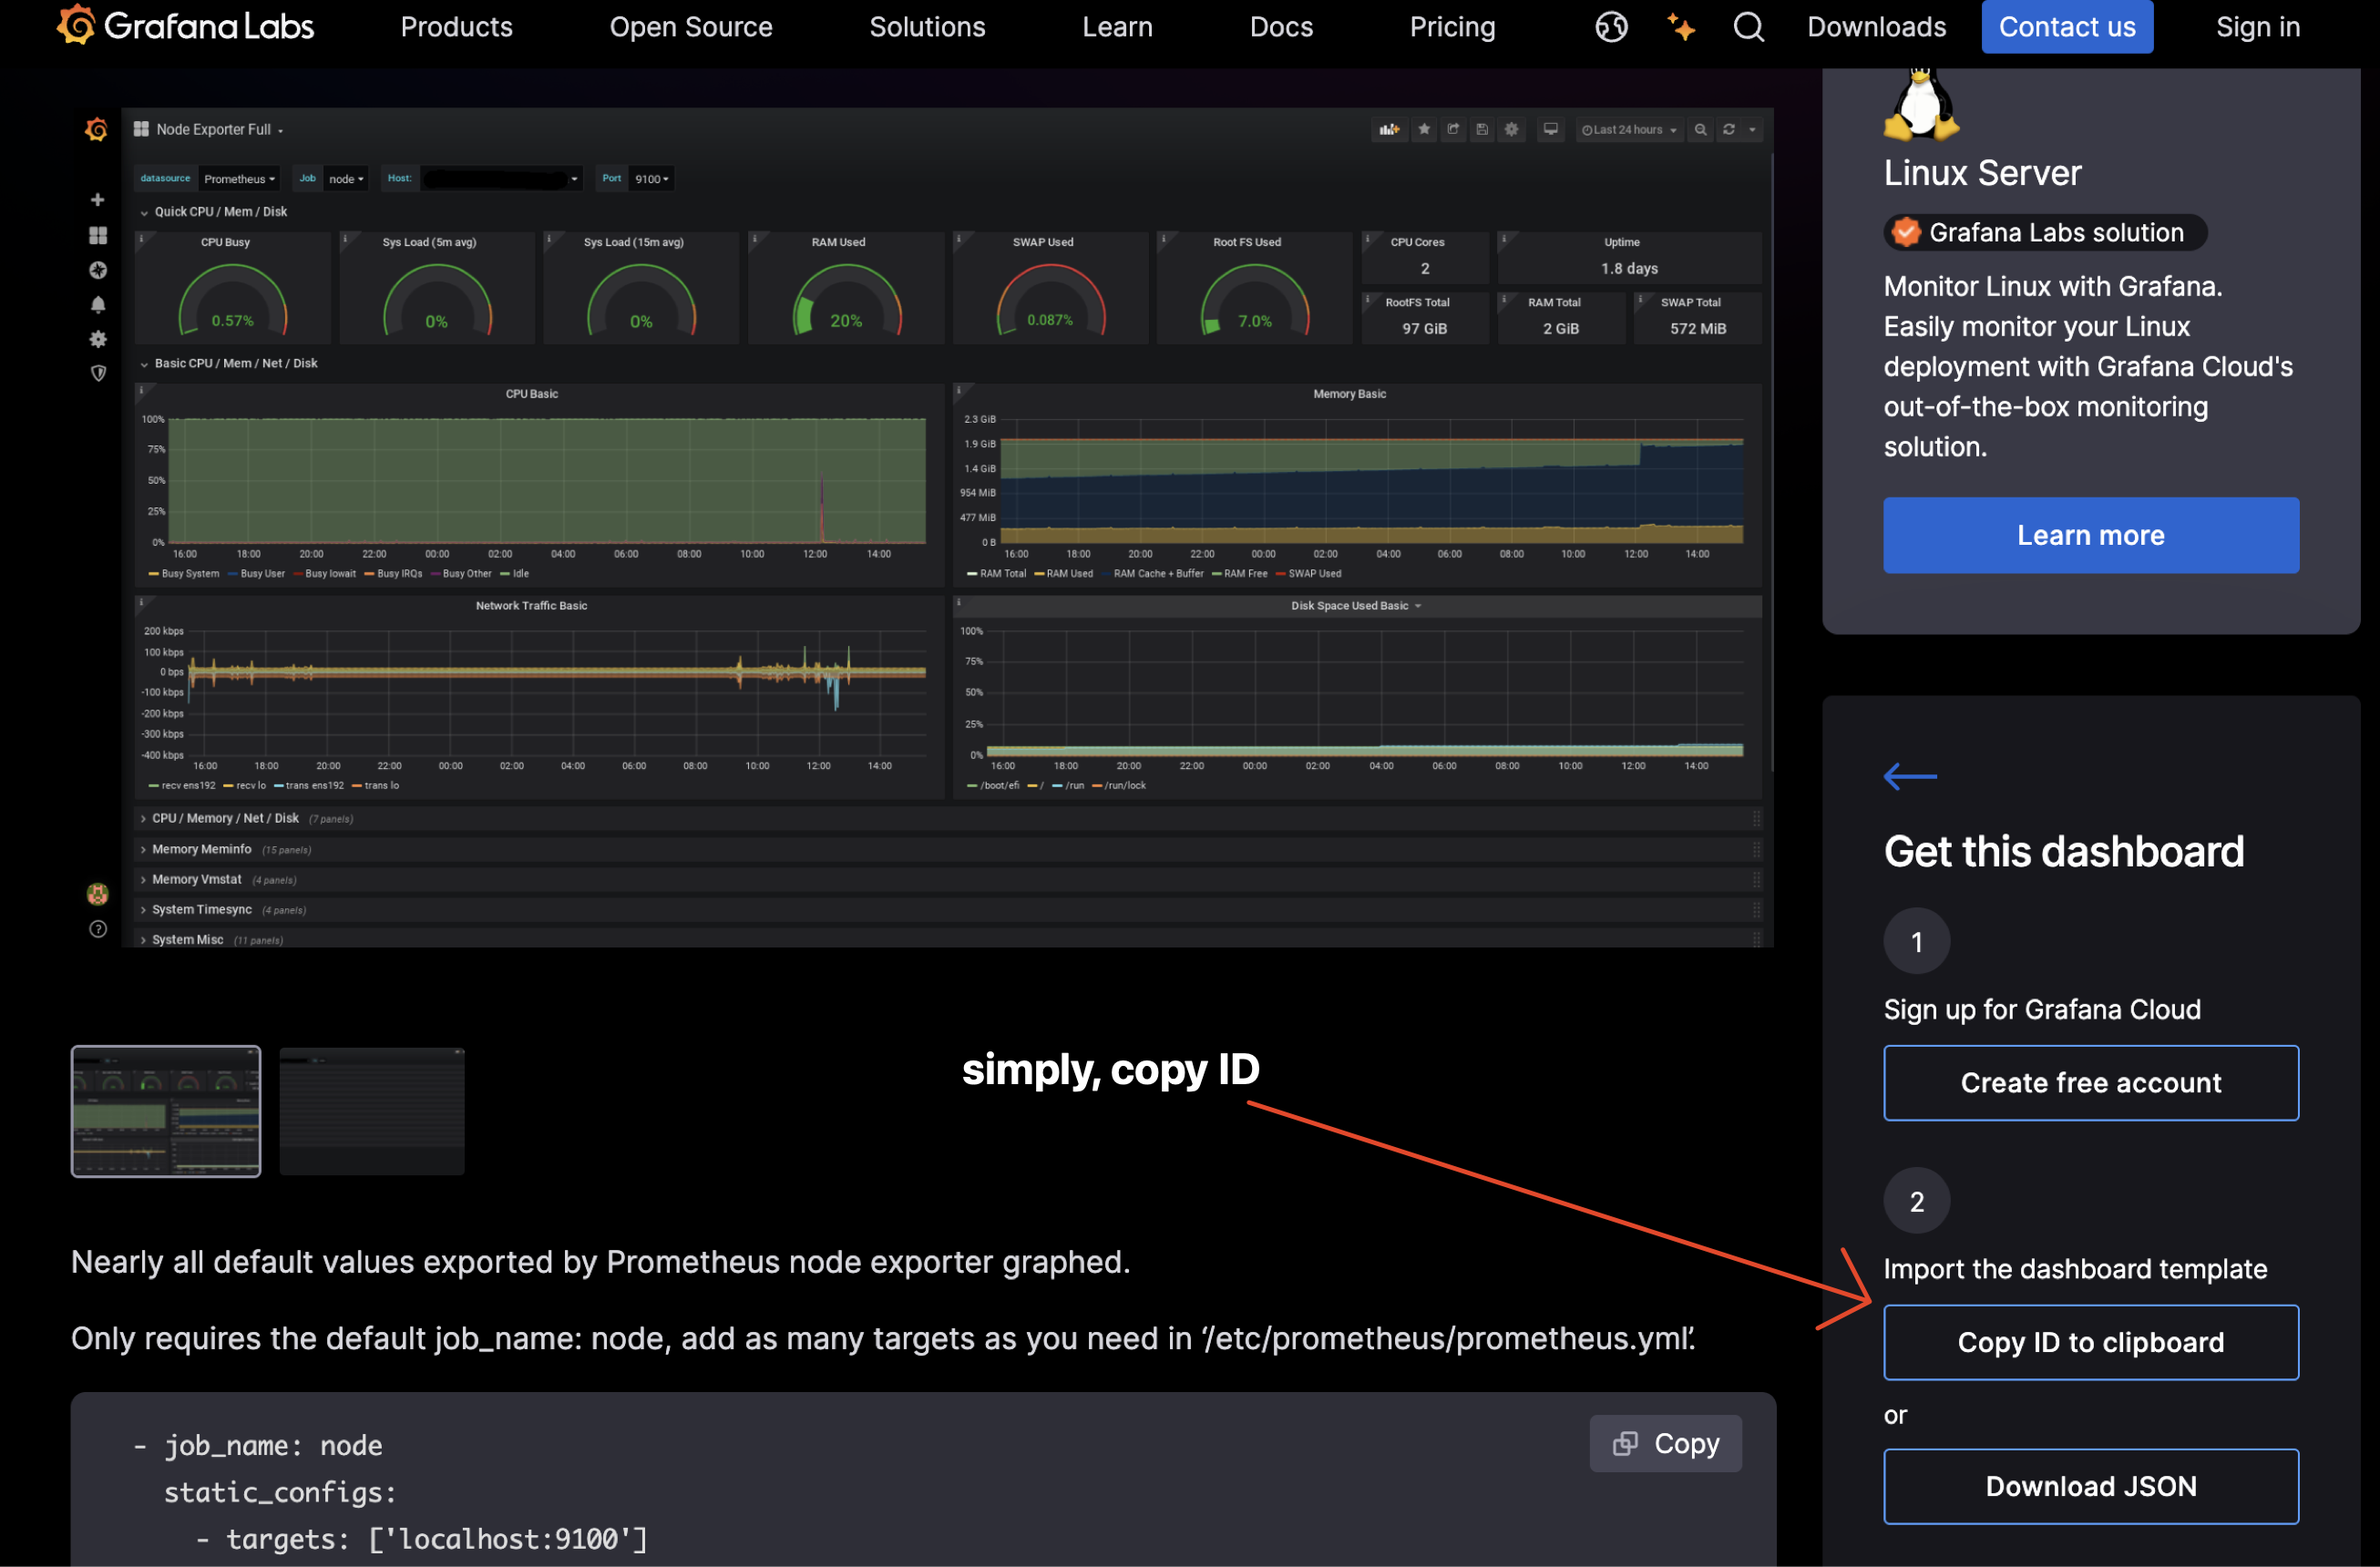
  1. Go to grafana dashboard sites and choose the dashboard you want to use. In this case, i choose https://grafana.com/grafana/dashboards/1860-node-exporter-full/. Copy ID from the dashboard. add-datasource

  2. After you copy the ID, go to your grafana Dashboad and click on the "New" and choose "Import". add-datasource

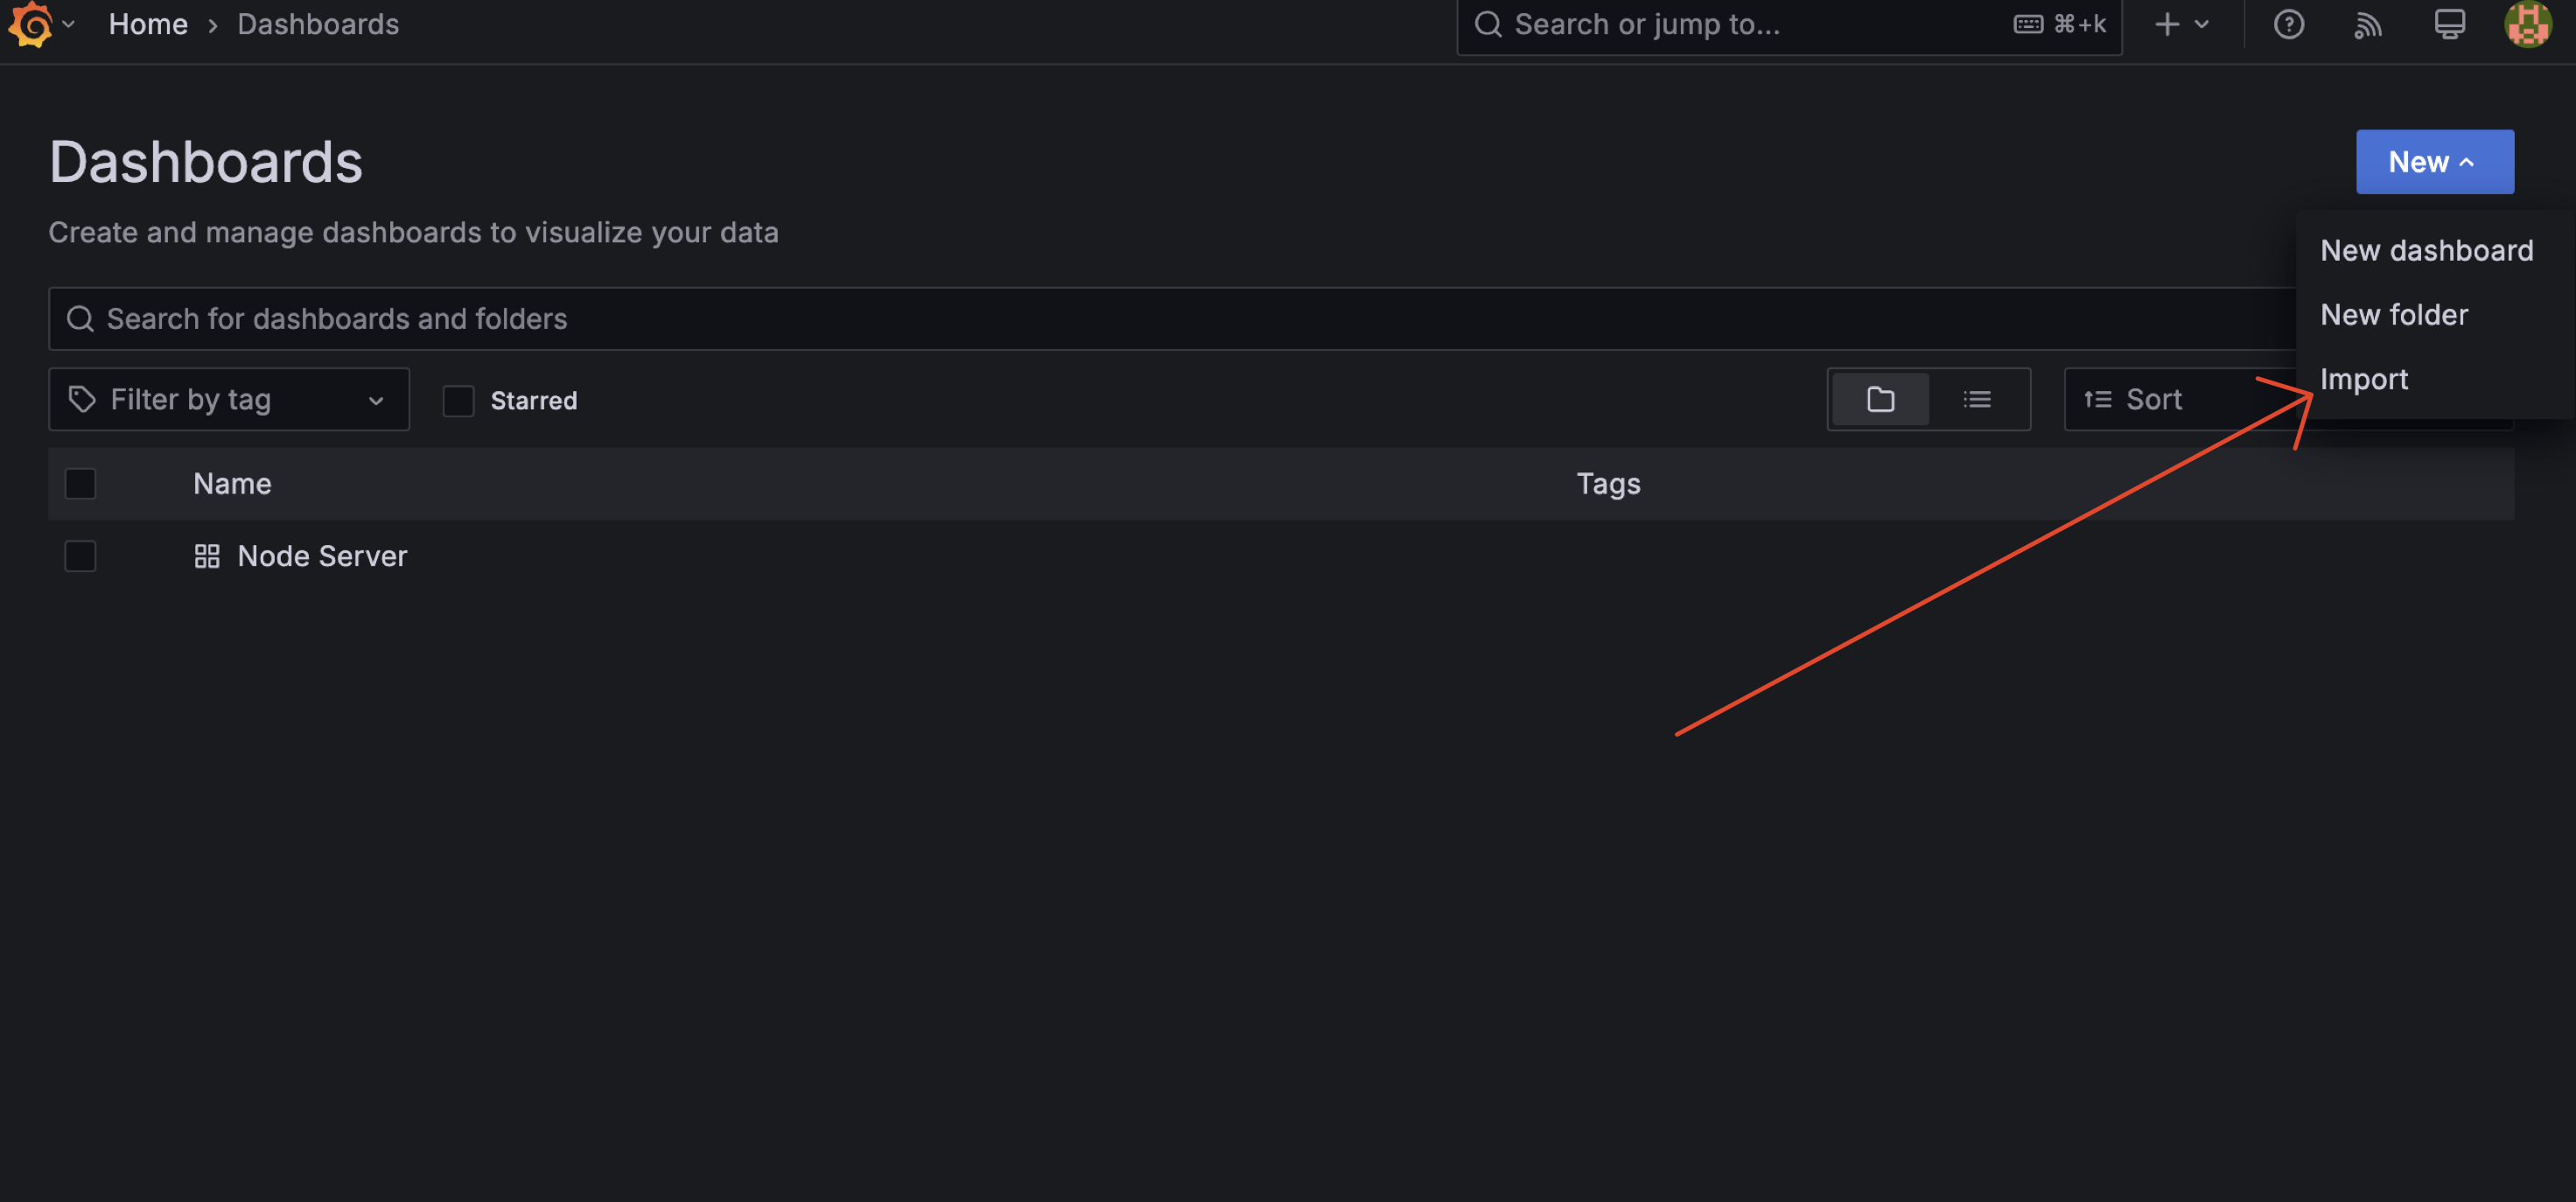
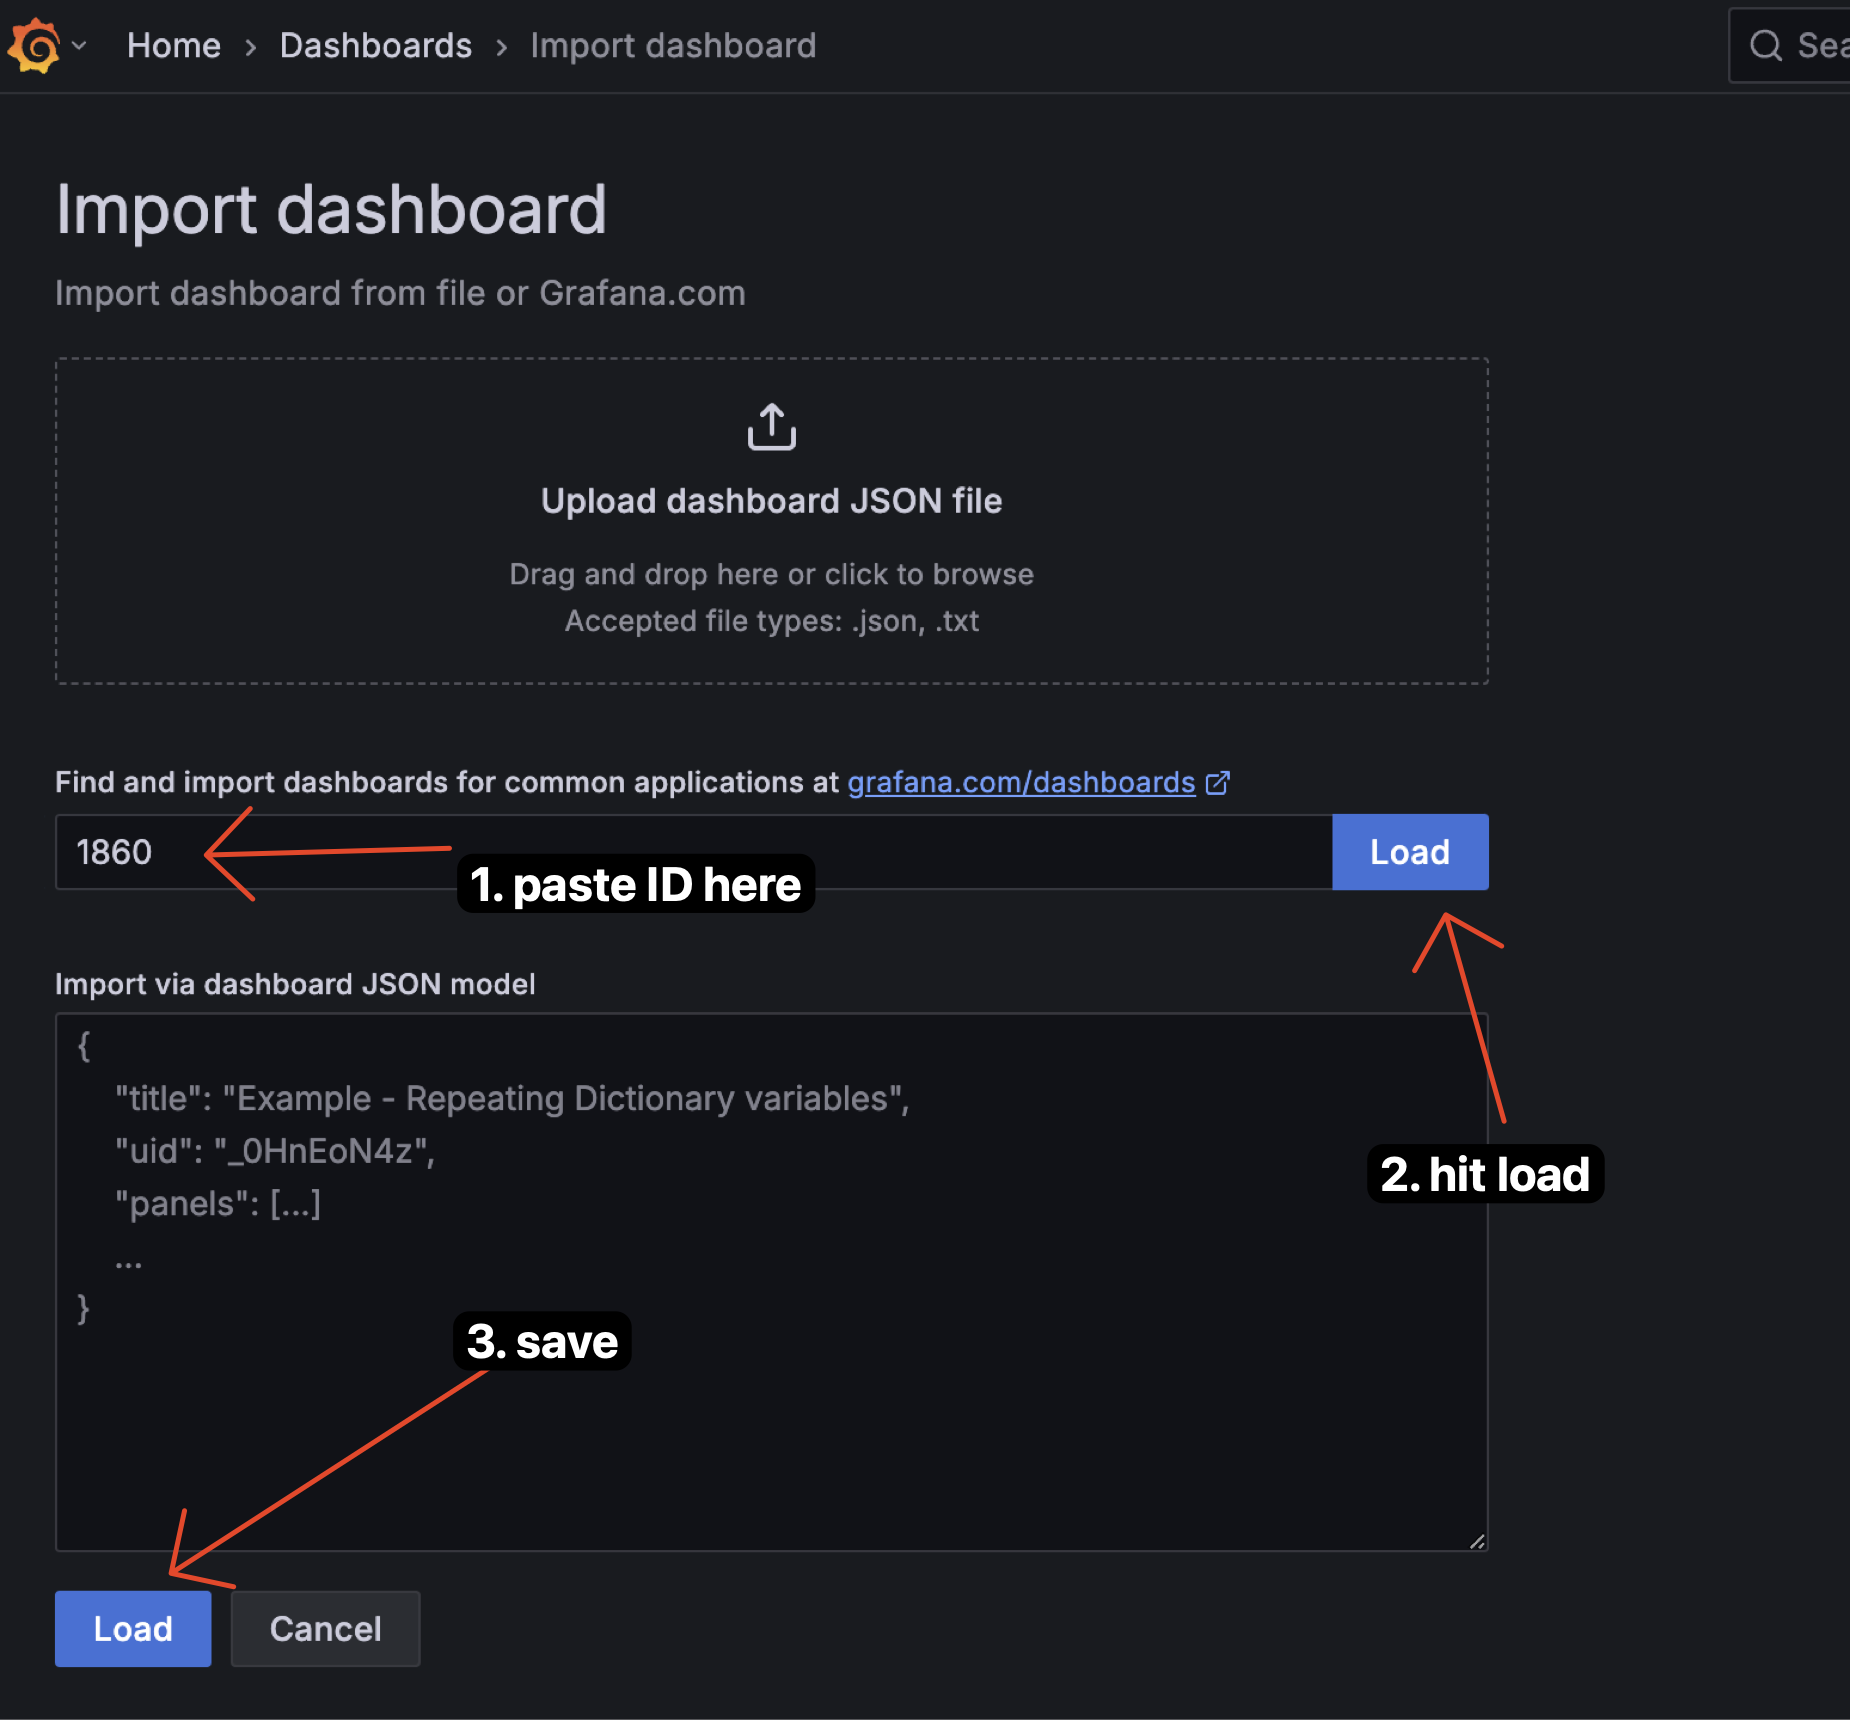
  3. Paste the ID you copied before and click "Load". add-datasource

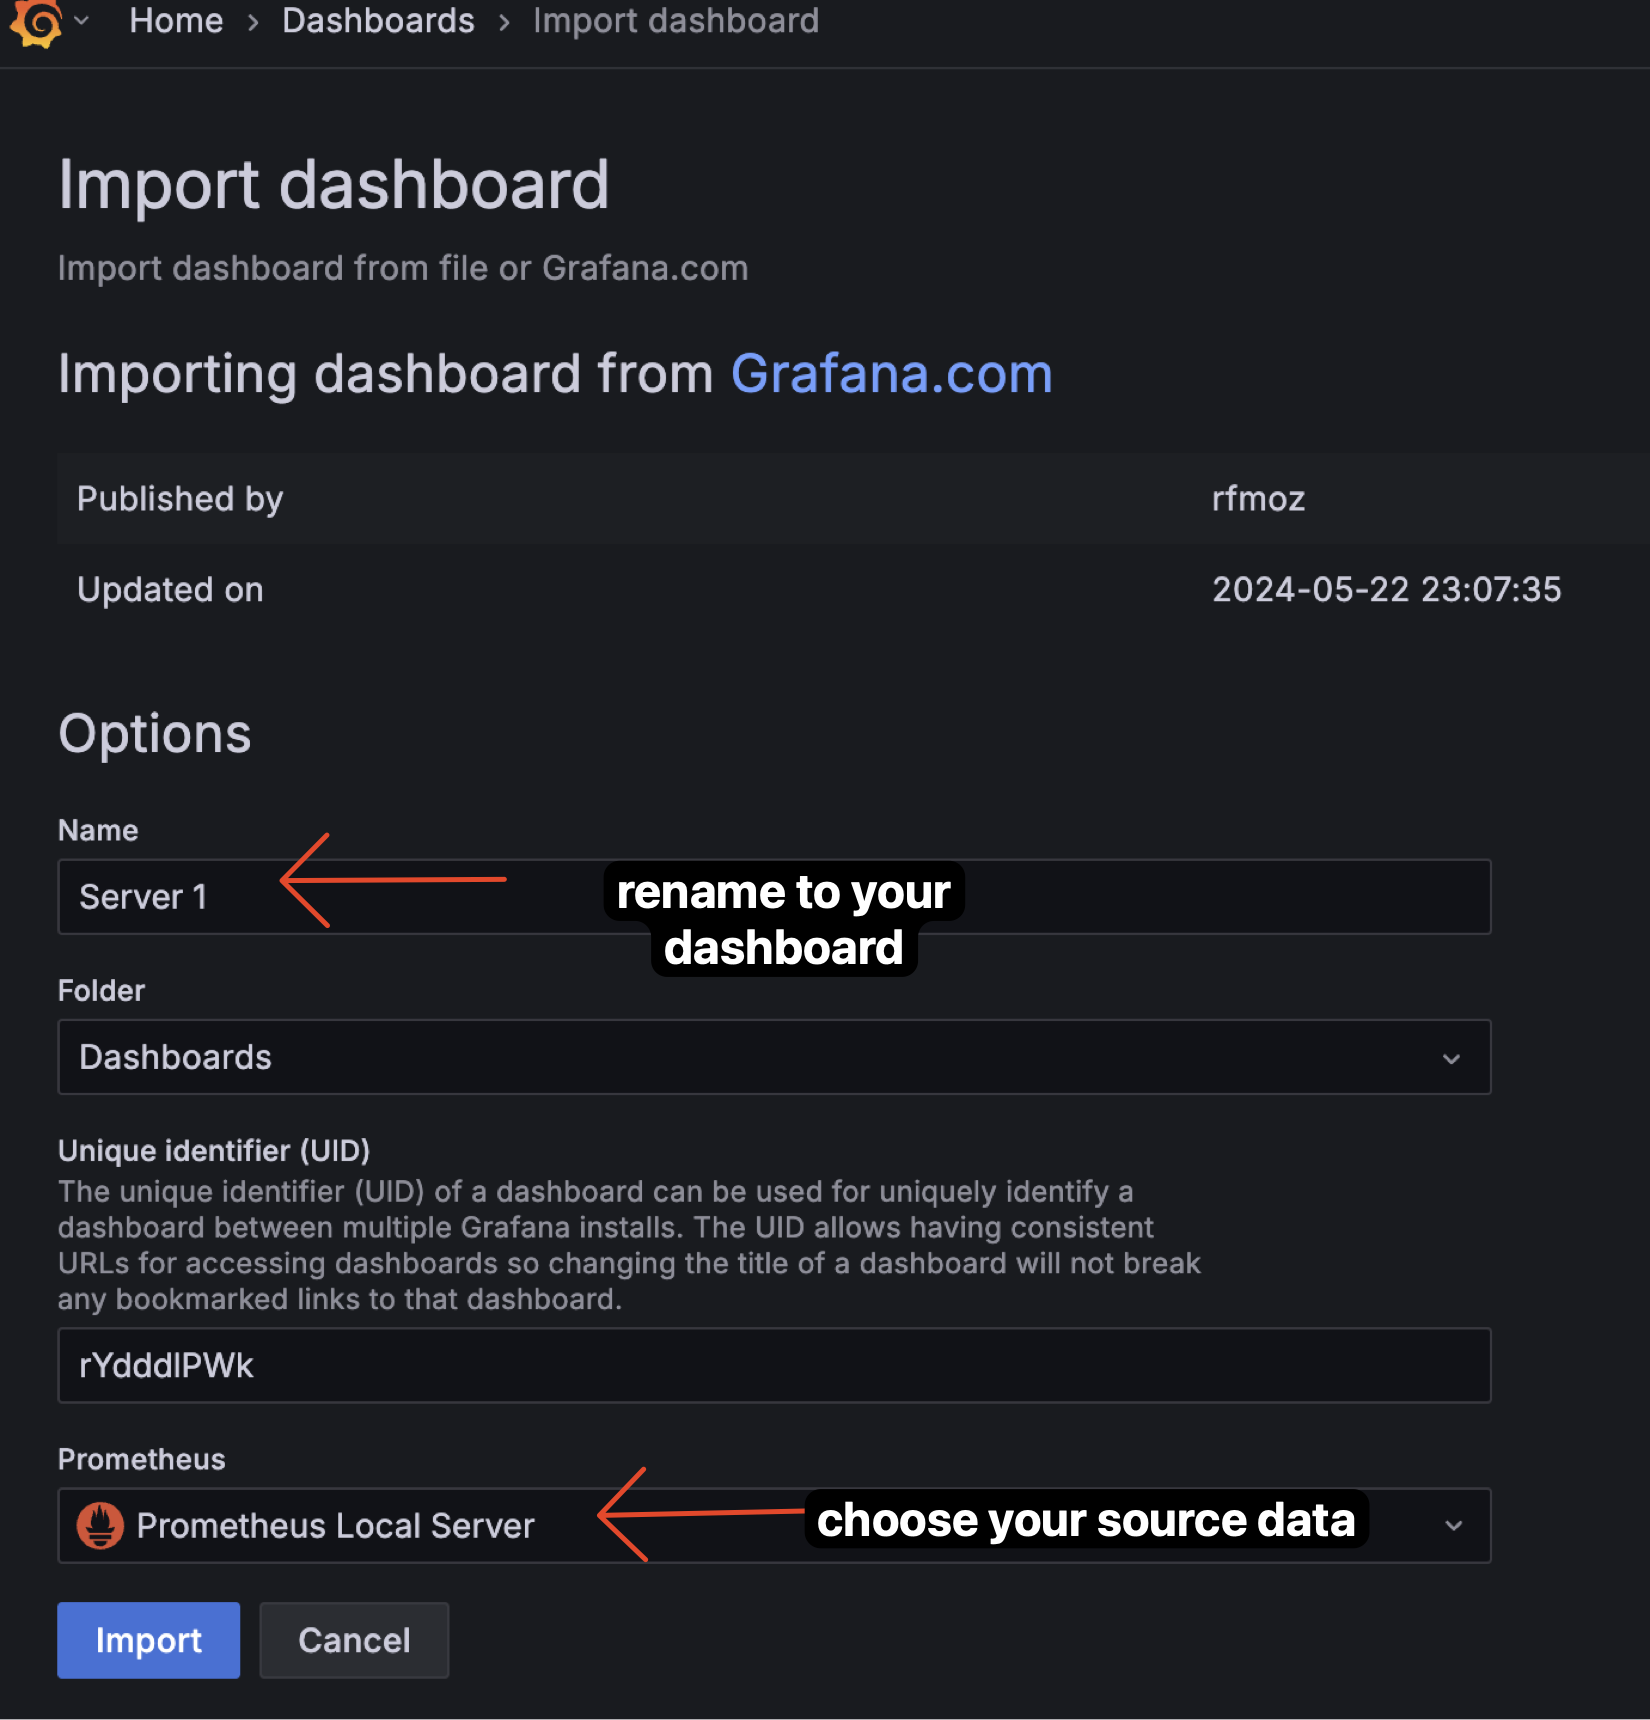
  4. Config that you can configure, and click "Import". This step we will rename the dashboard and choose the datasource. And Click "Import".
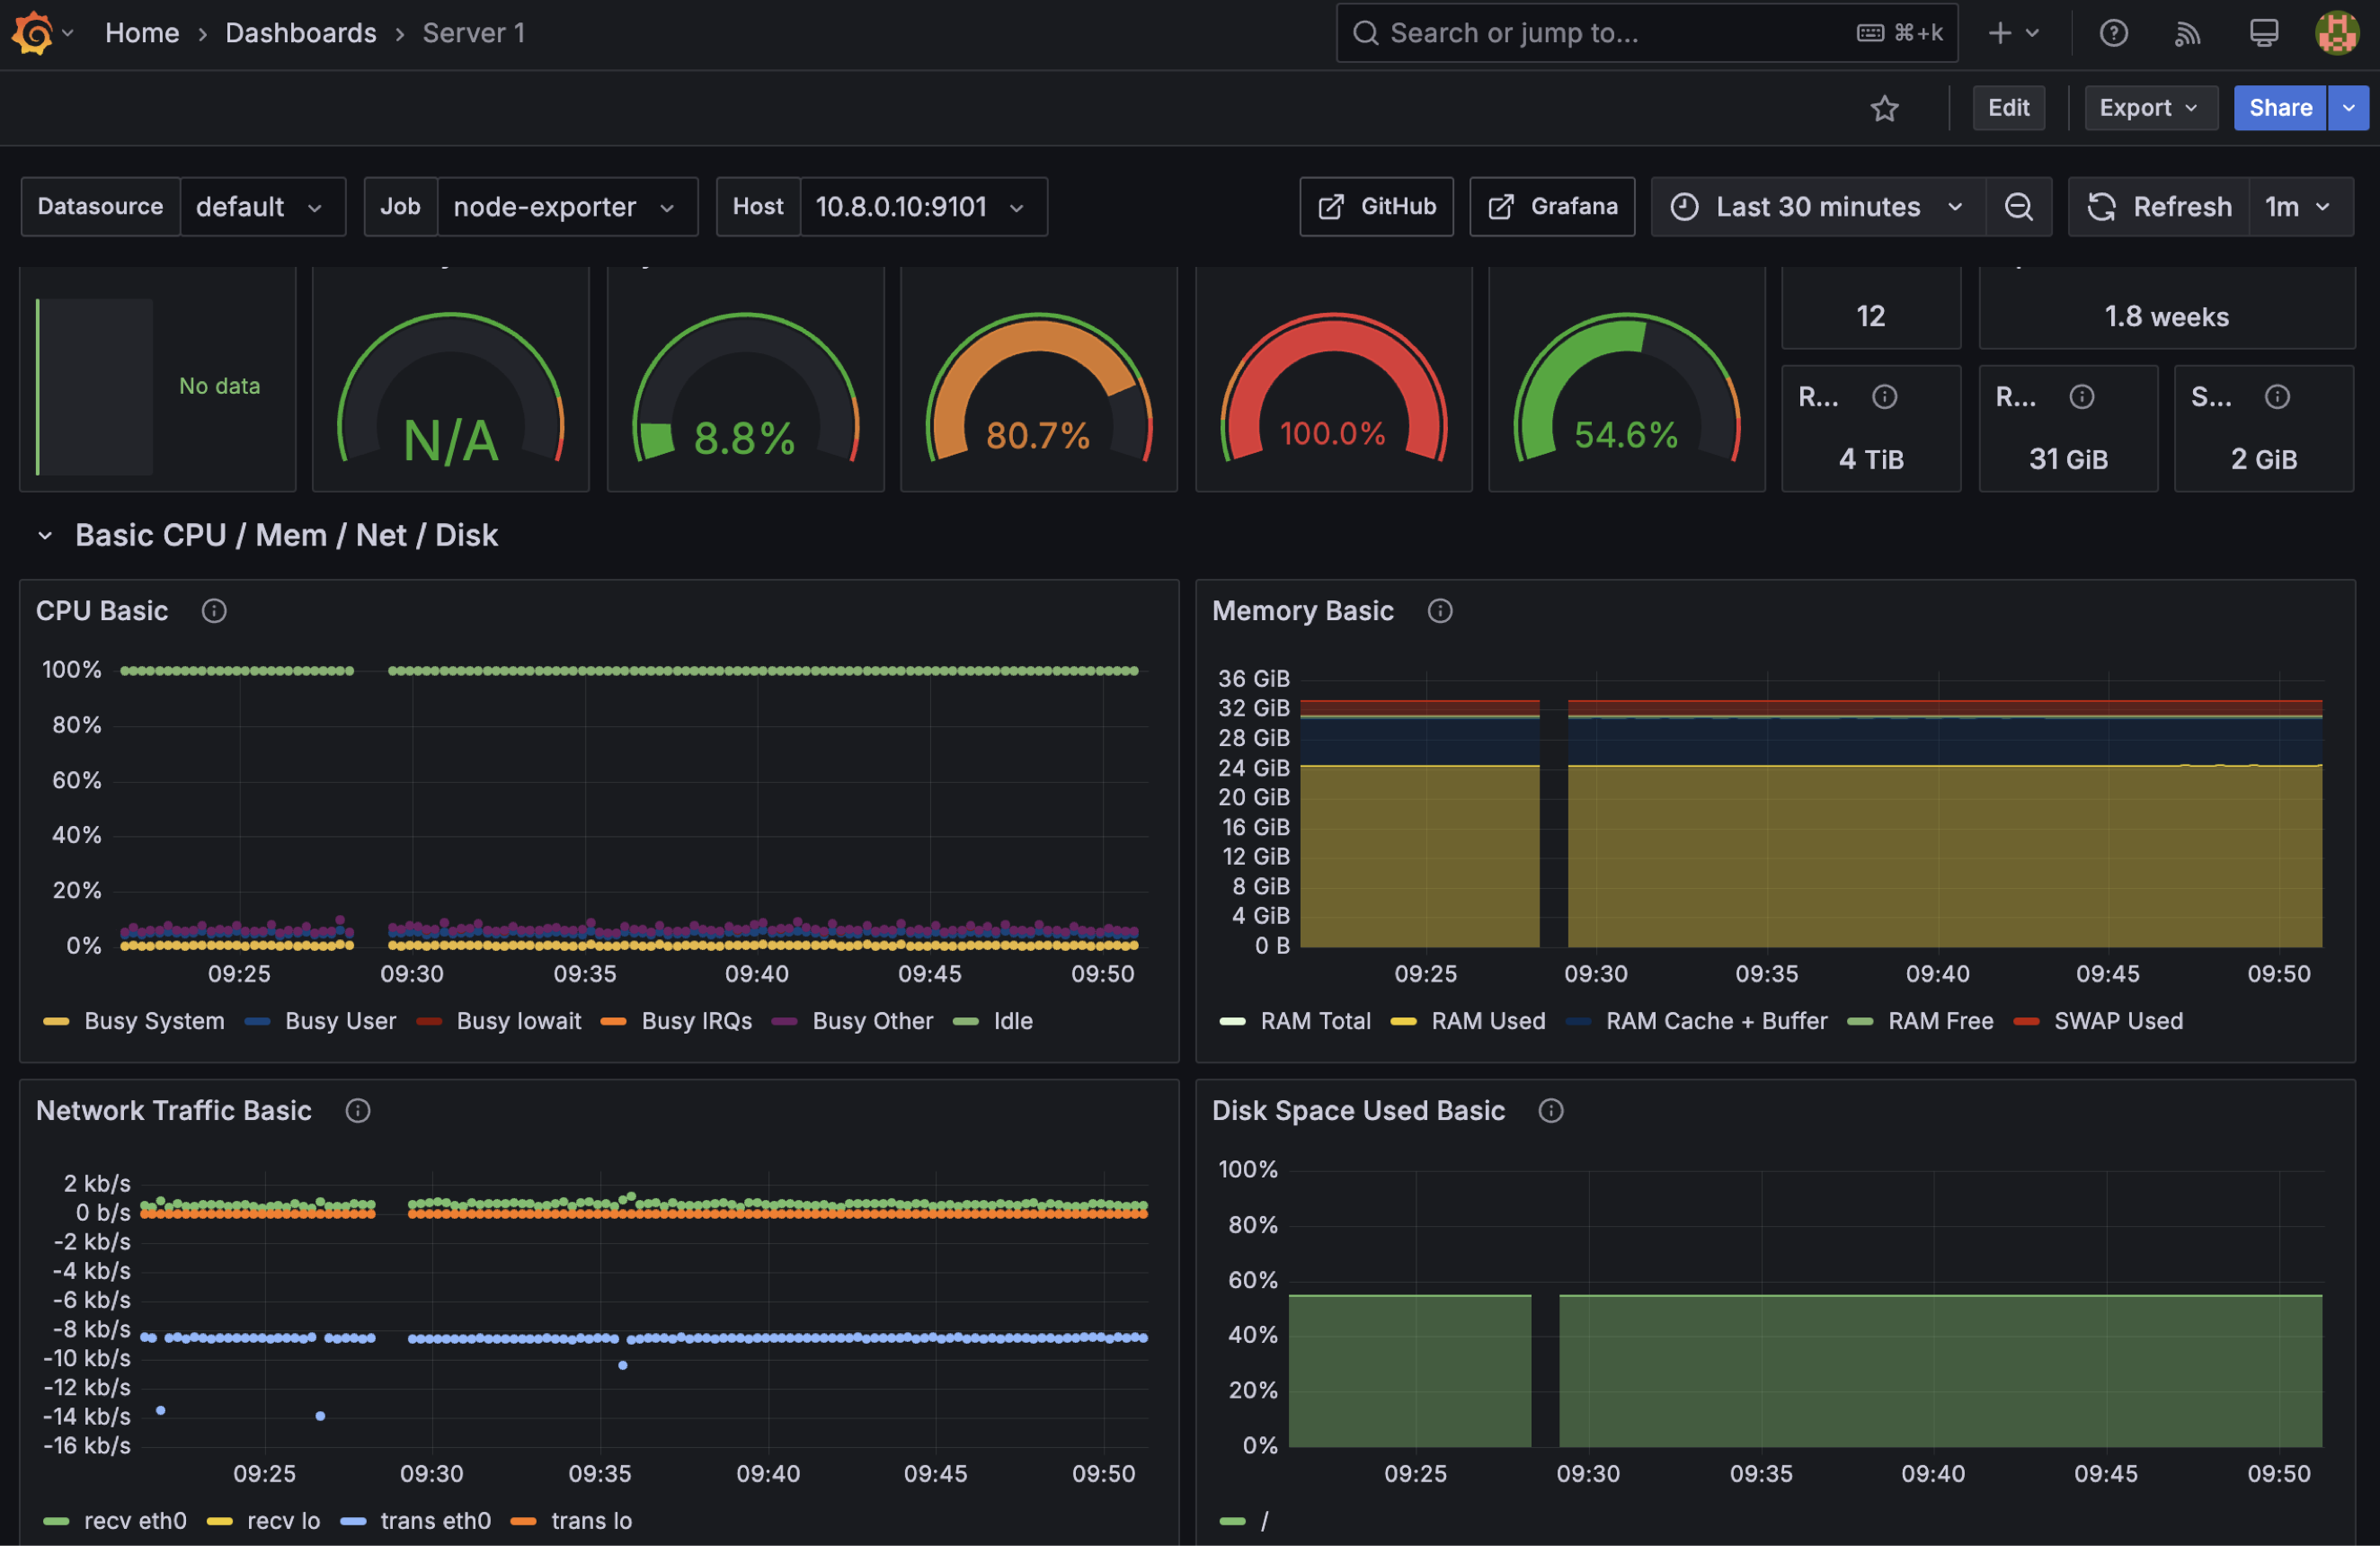
 add-datasource

  5. This the result 🔥🔥🔥 add-datasource

3.3 Add Alert

Oke, after we have a dashboard, now we can add alert to our dashboard. We can add alert to our dashboard by clicking on the "Alert" tab on the top of the dashboard.

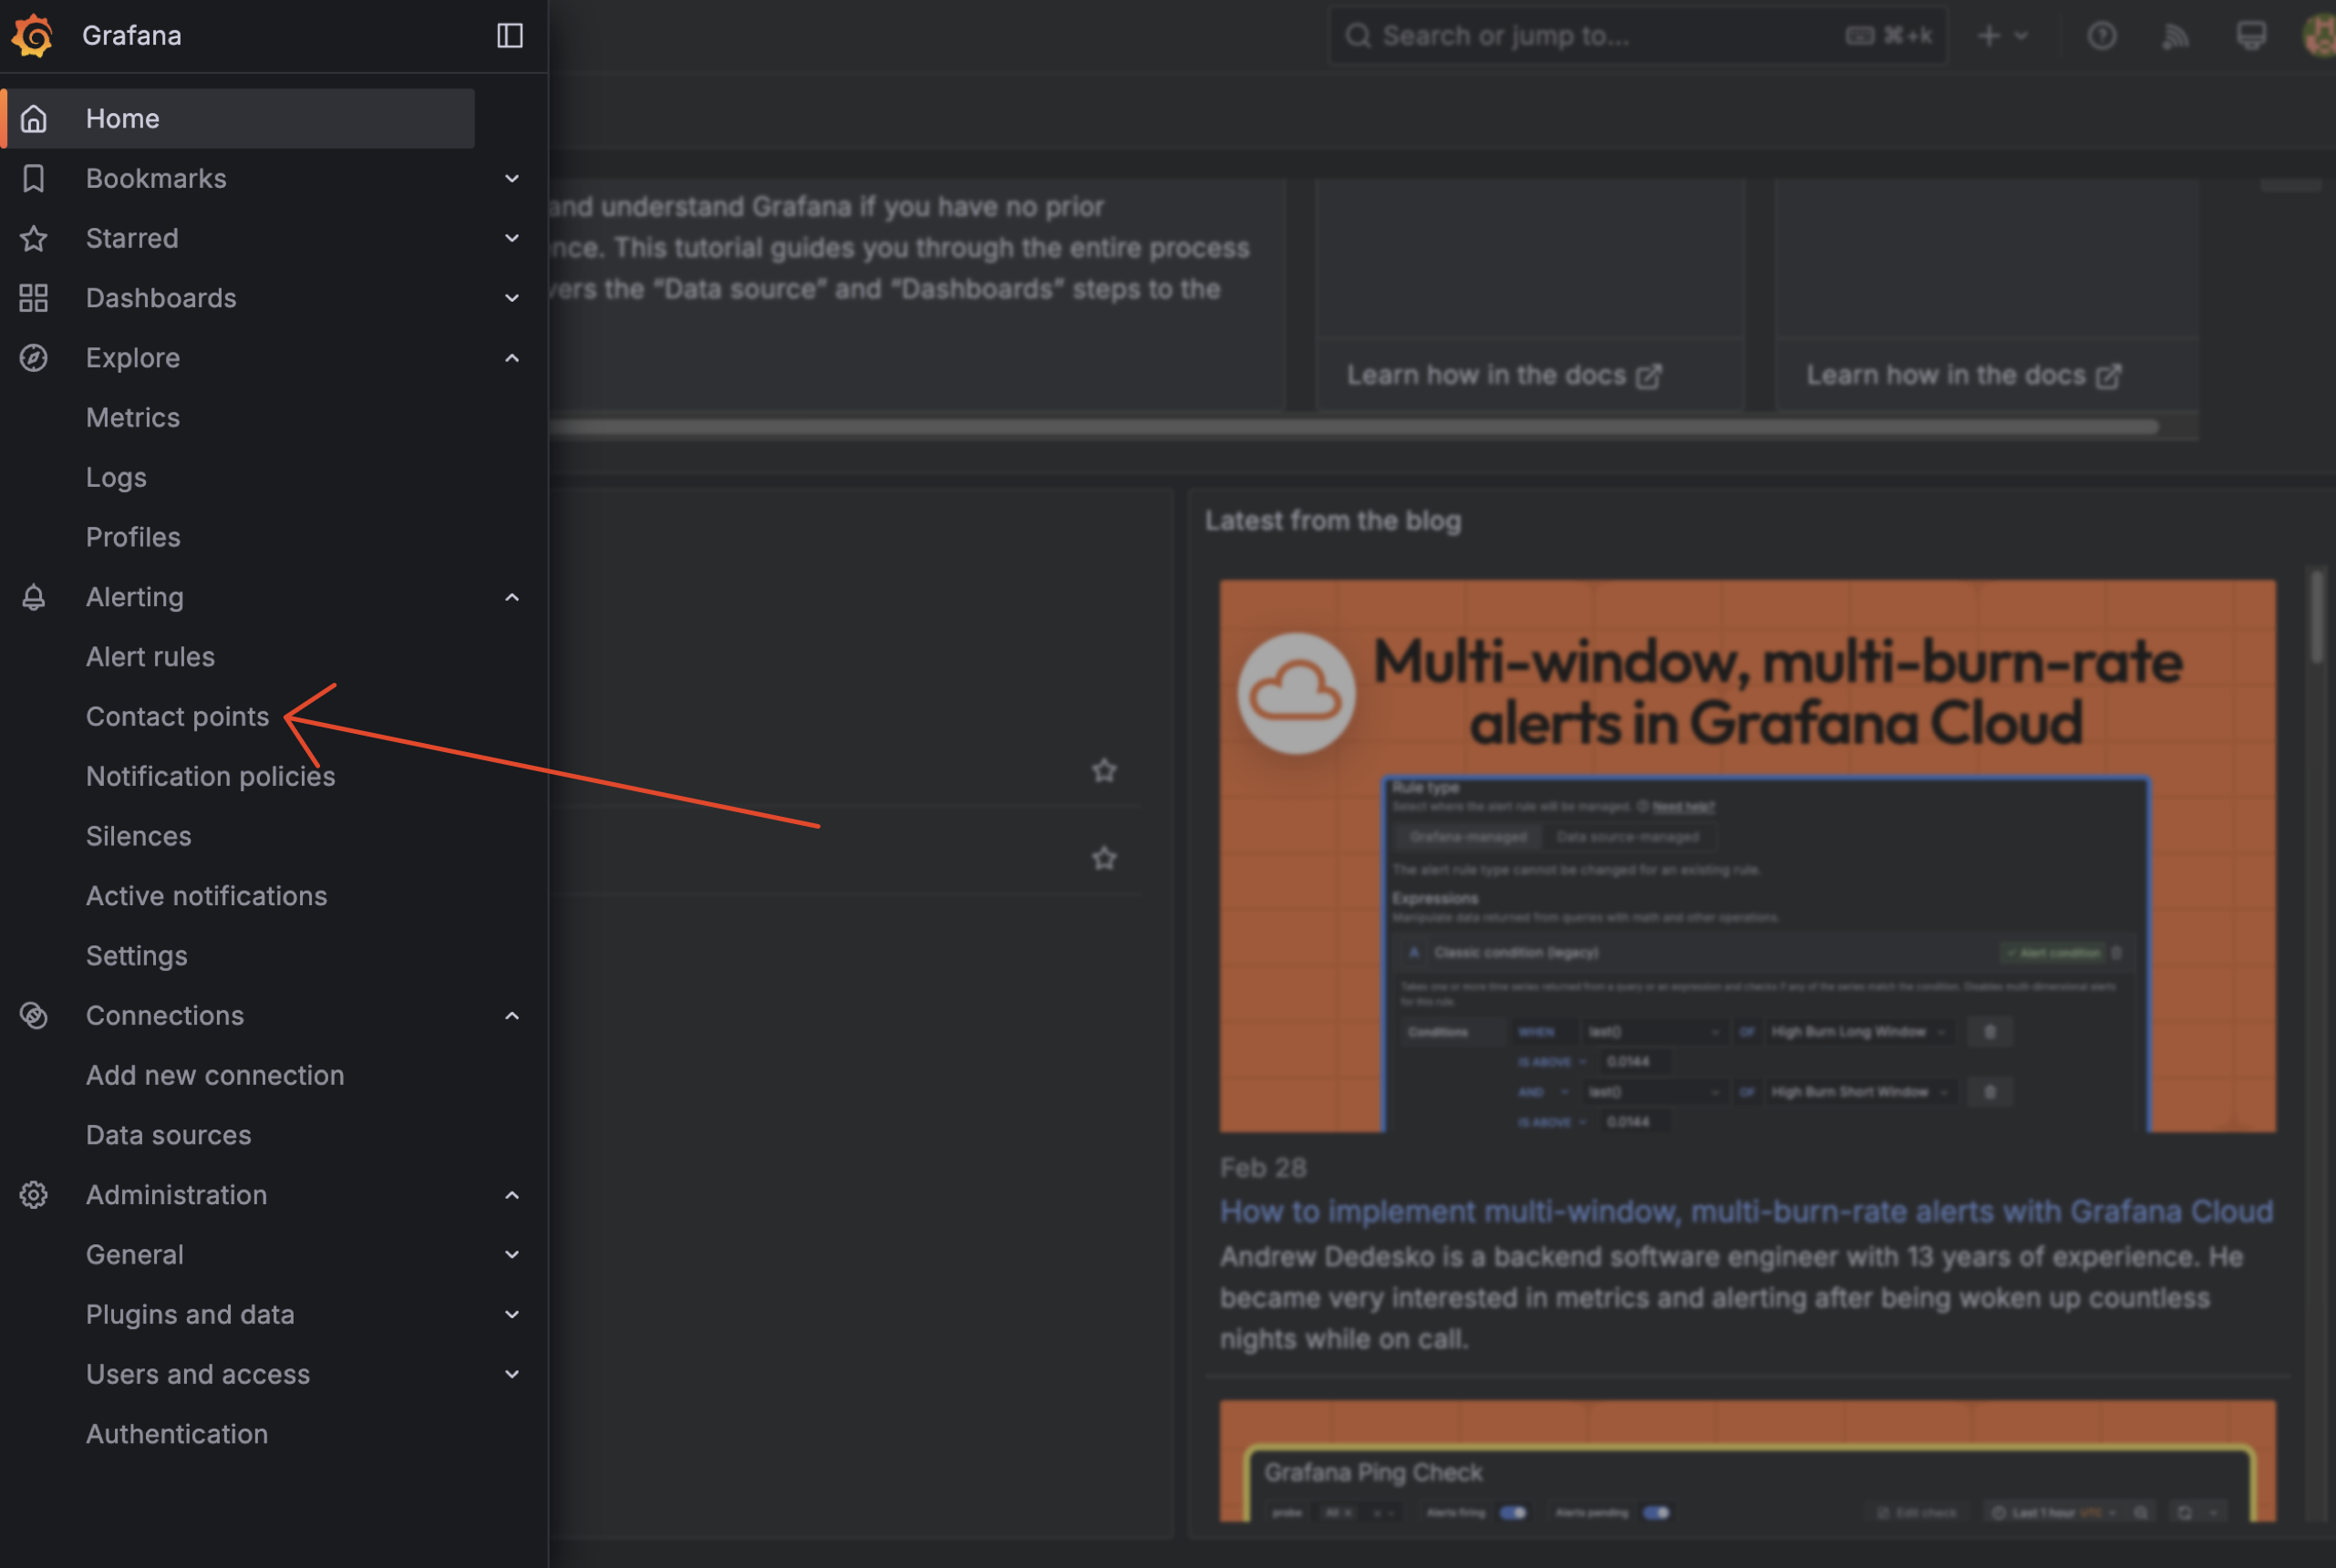
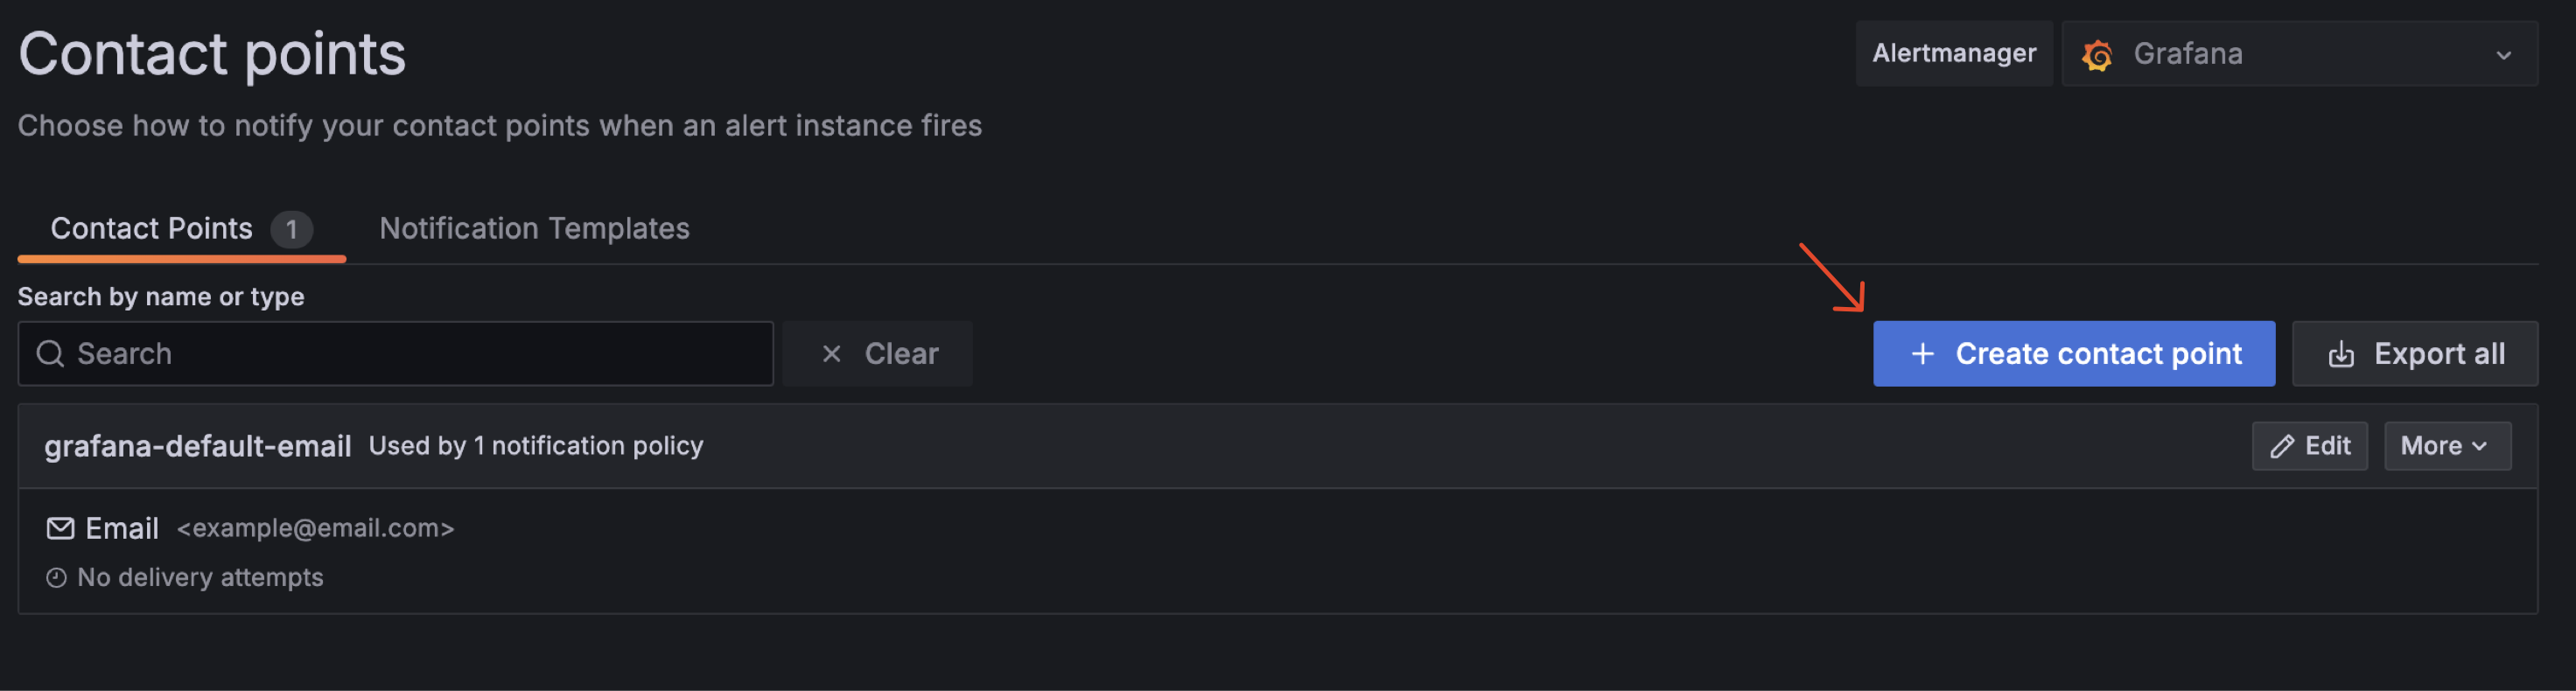
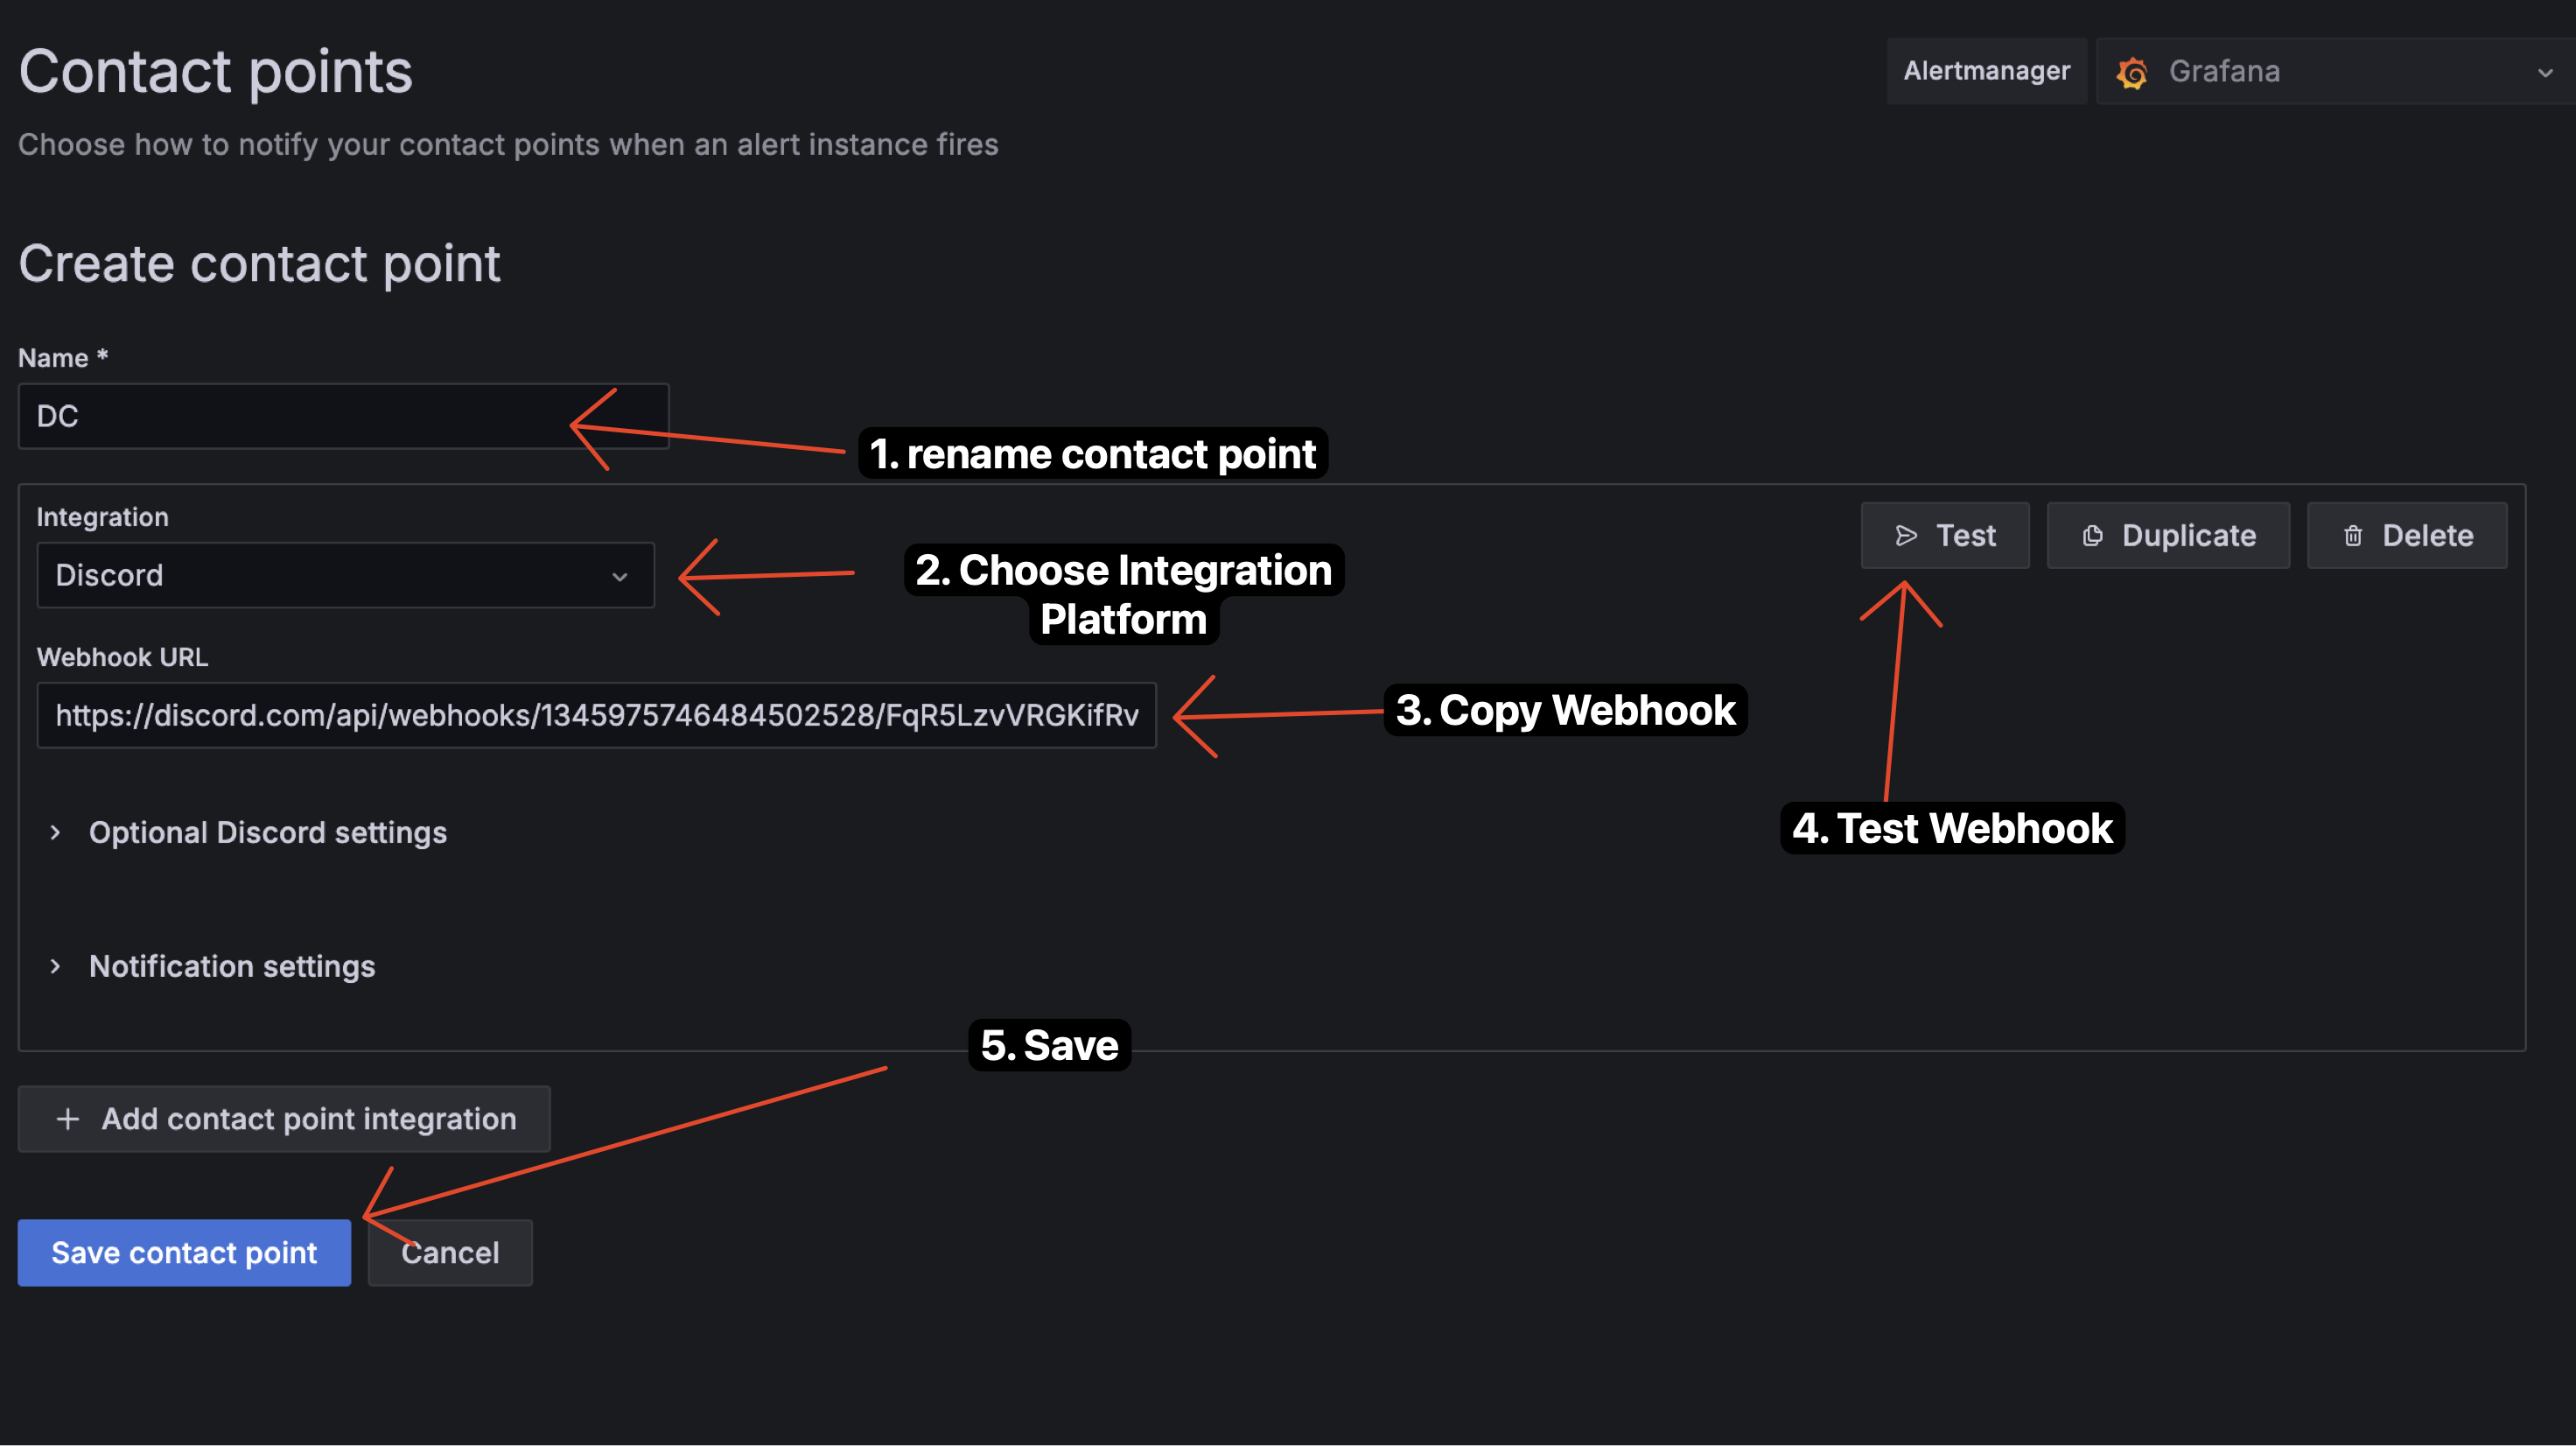
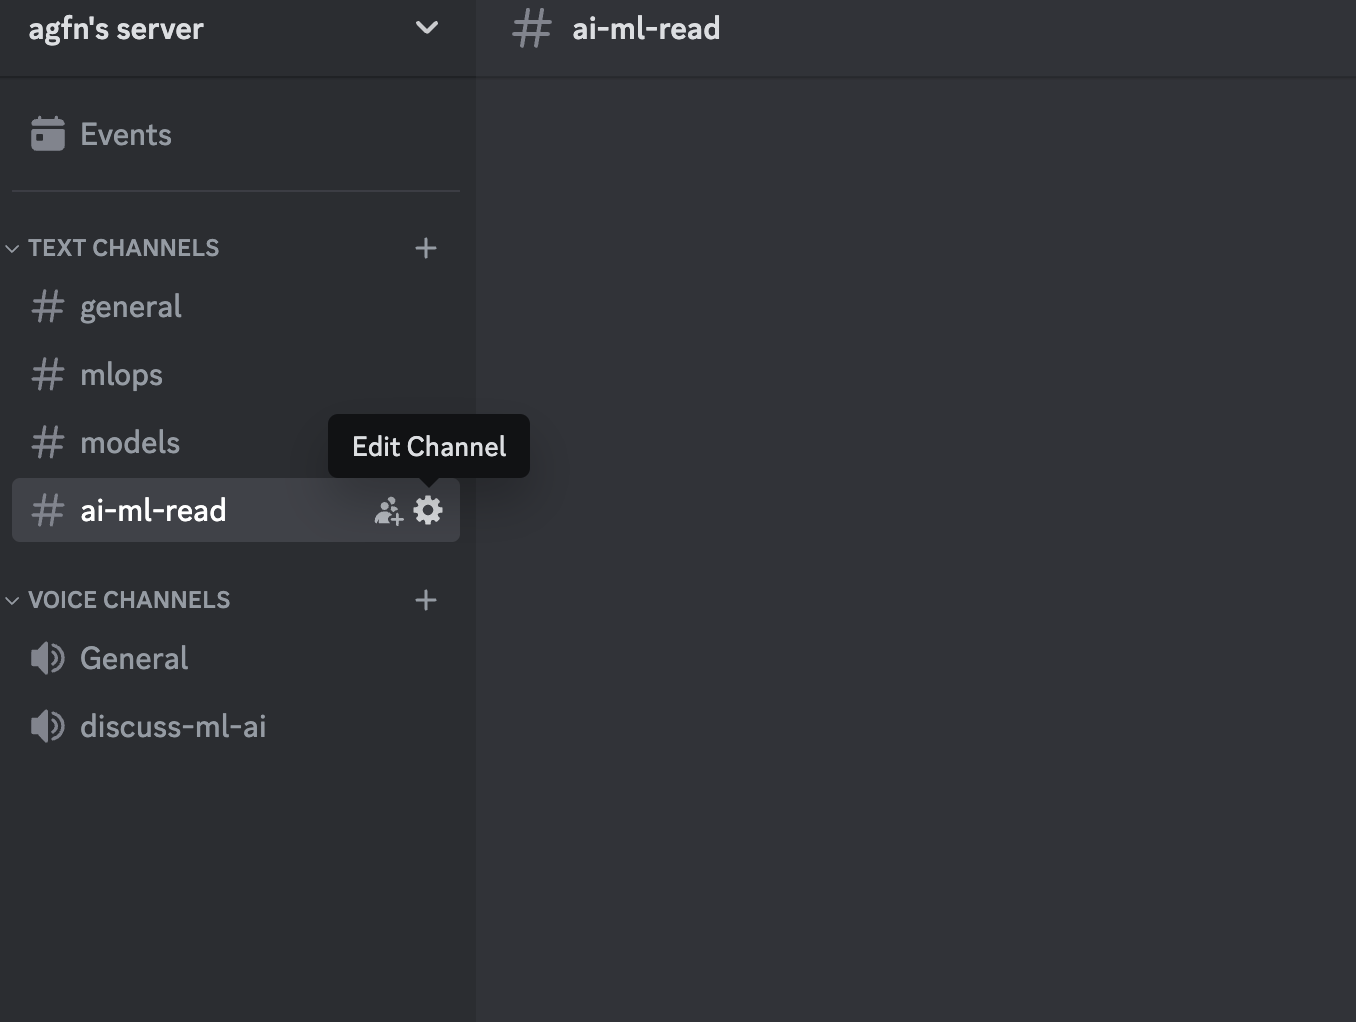
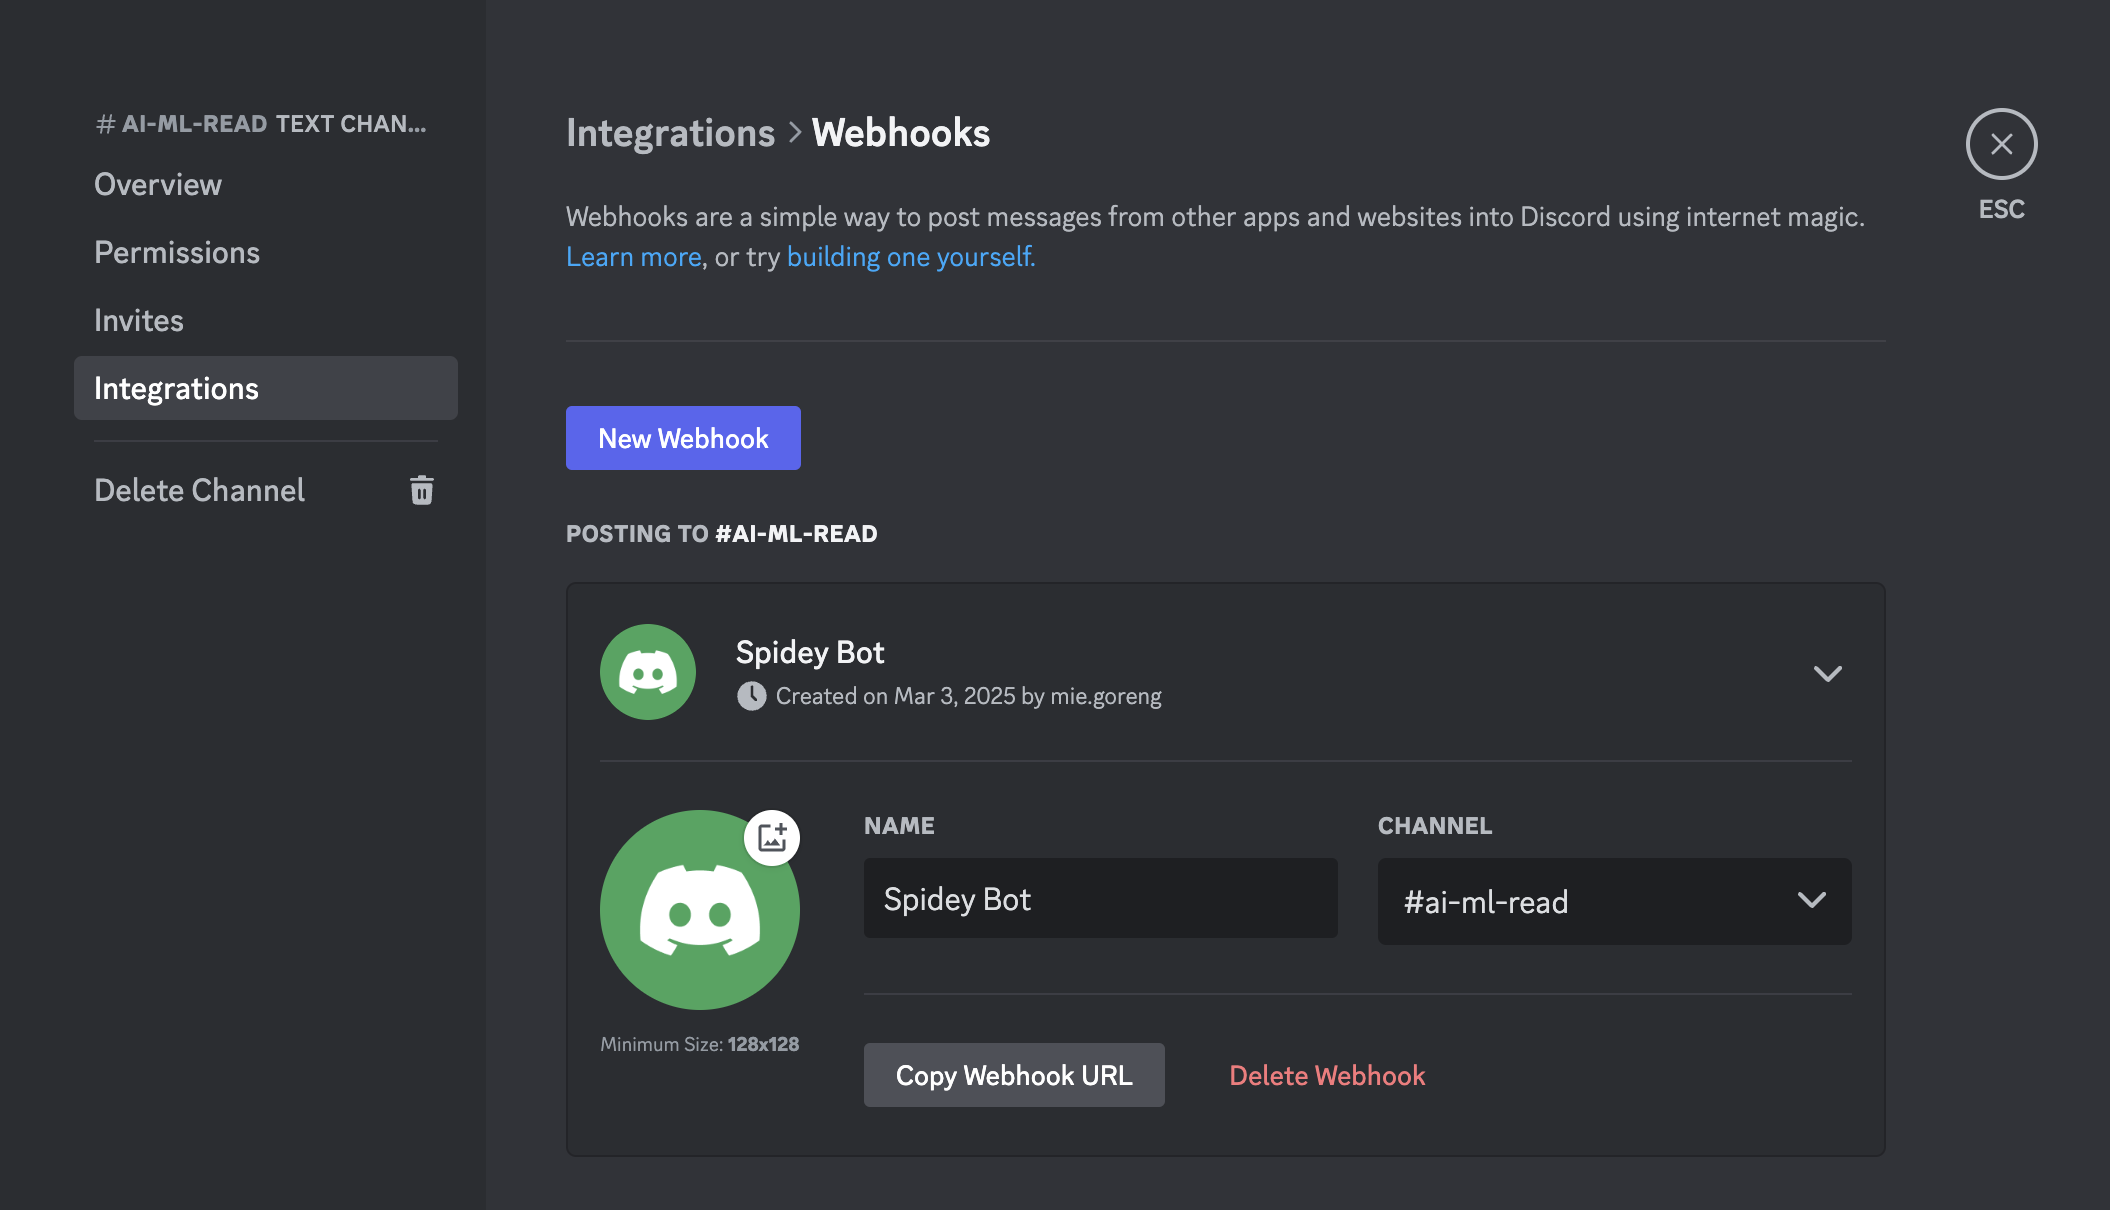
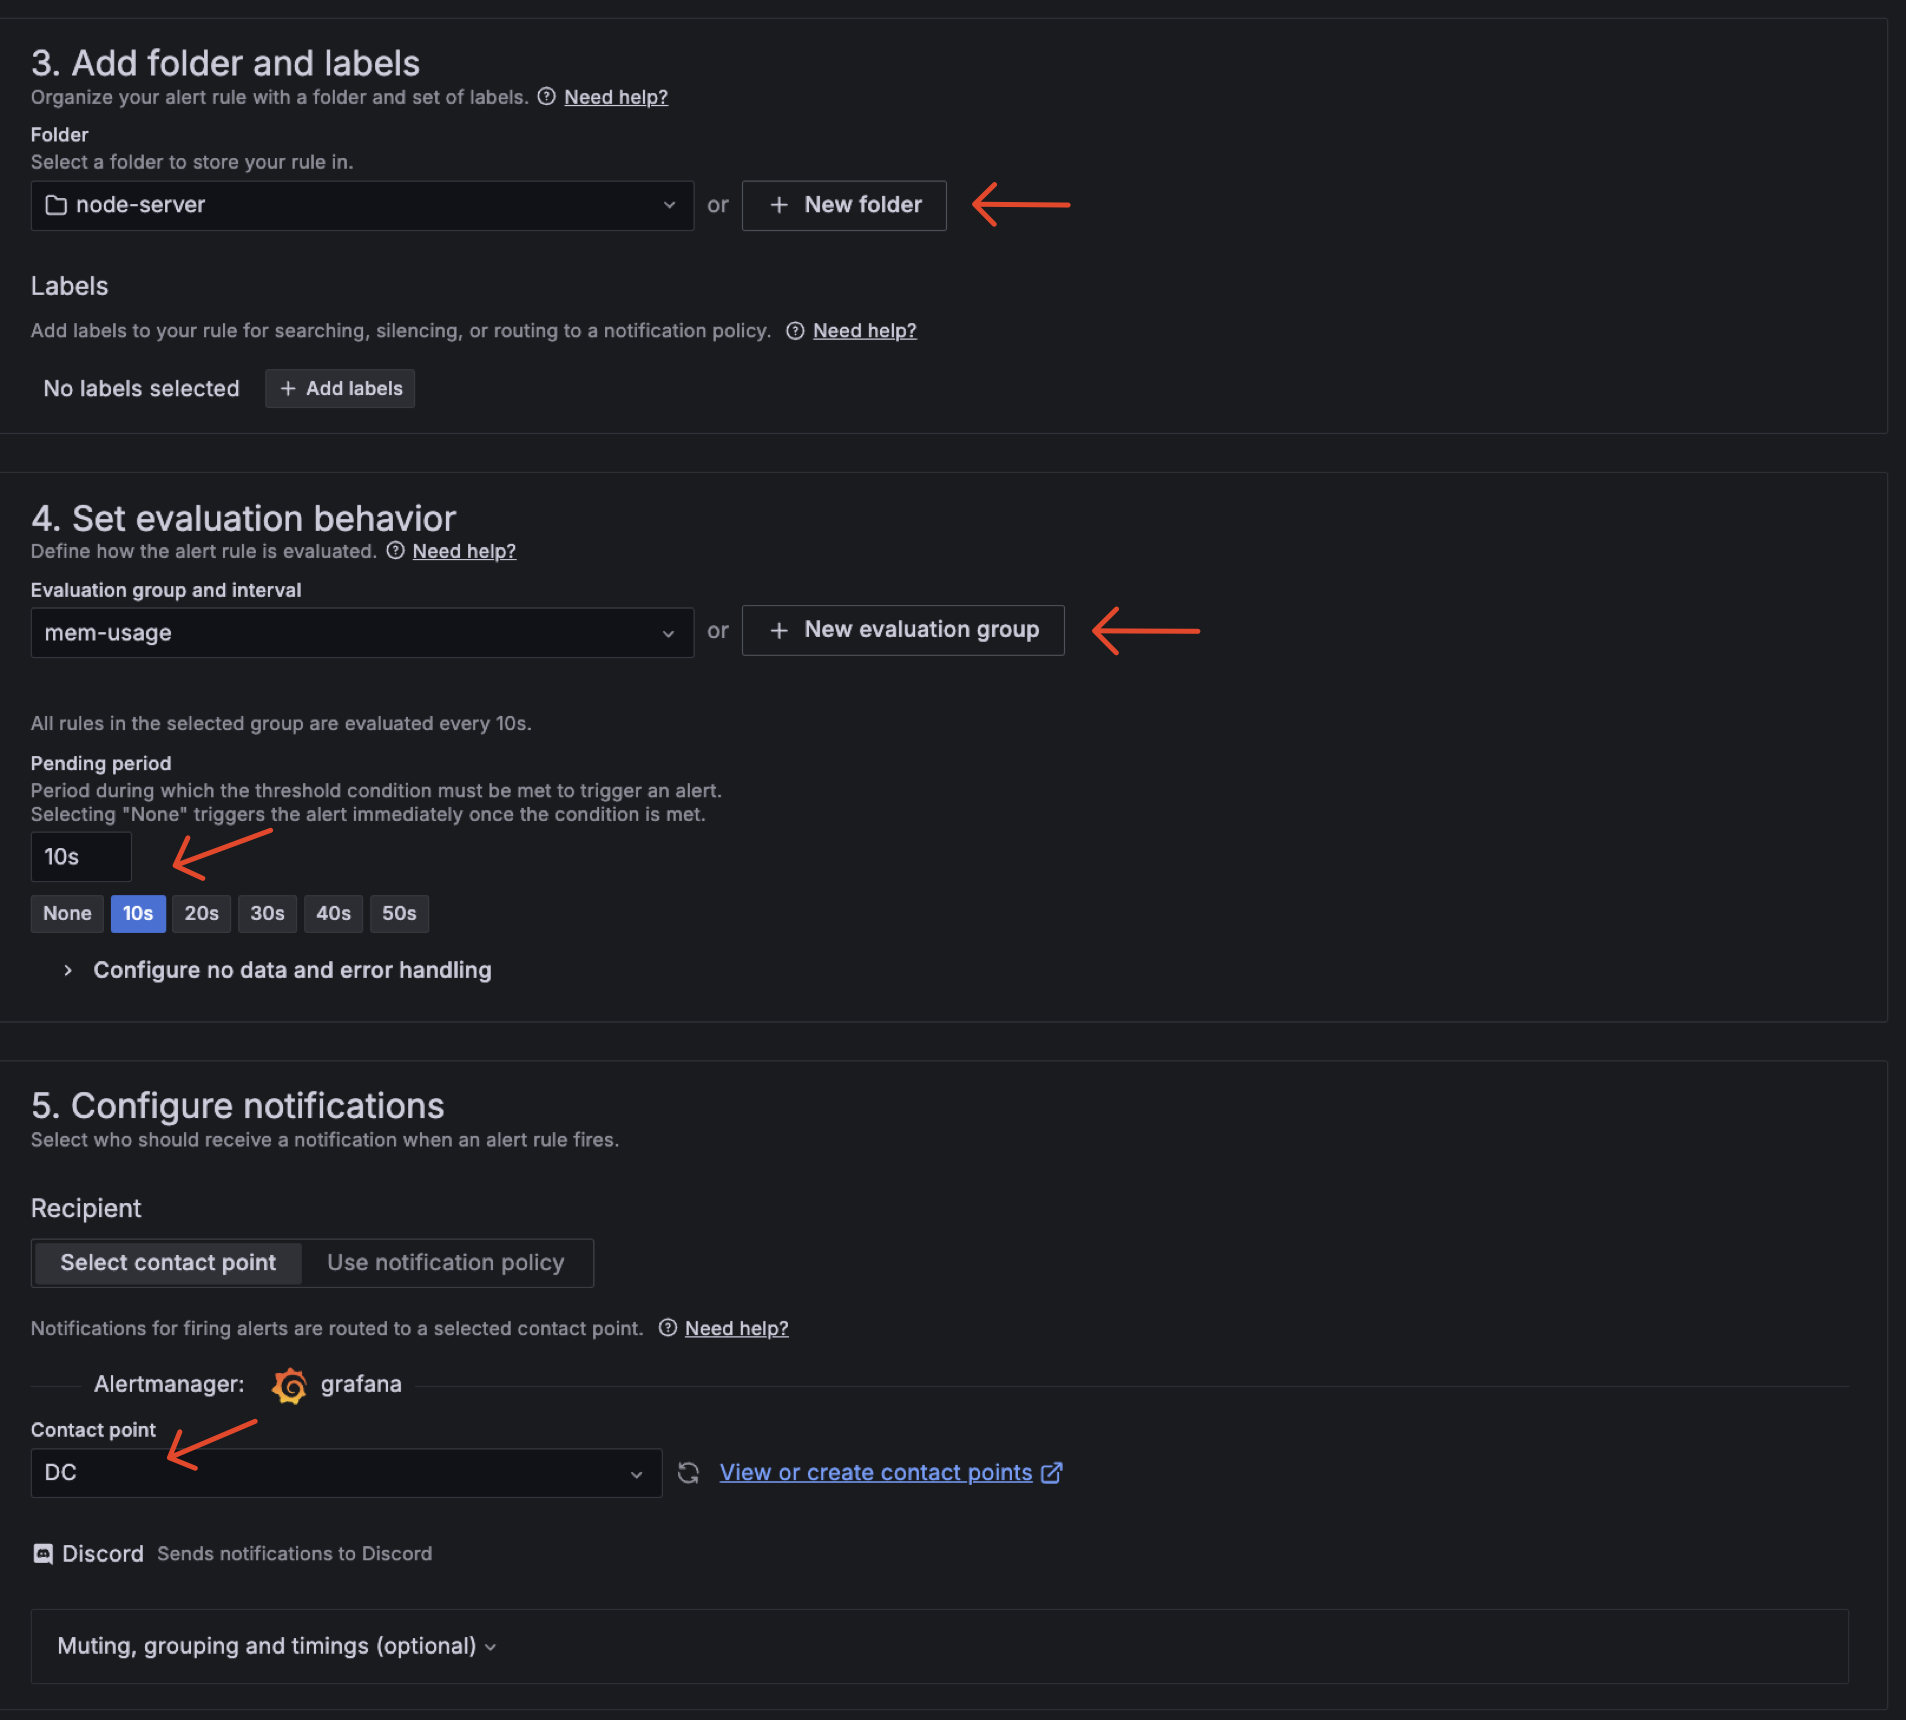
3.3.1 Add Contact Point

First, we need to add contact point to our grafana. We can add contact point by clicking on the "Alerting" tab on the left side of the dashboard and choose "Contact points".

Step Add Contact Point

add-datasource add-datasource add-datasource add-datasource add-datasource add-datasource

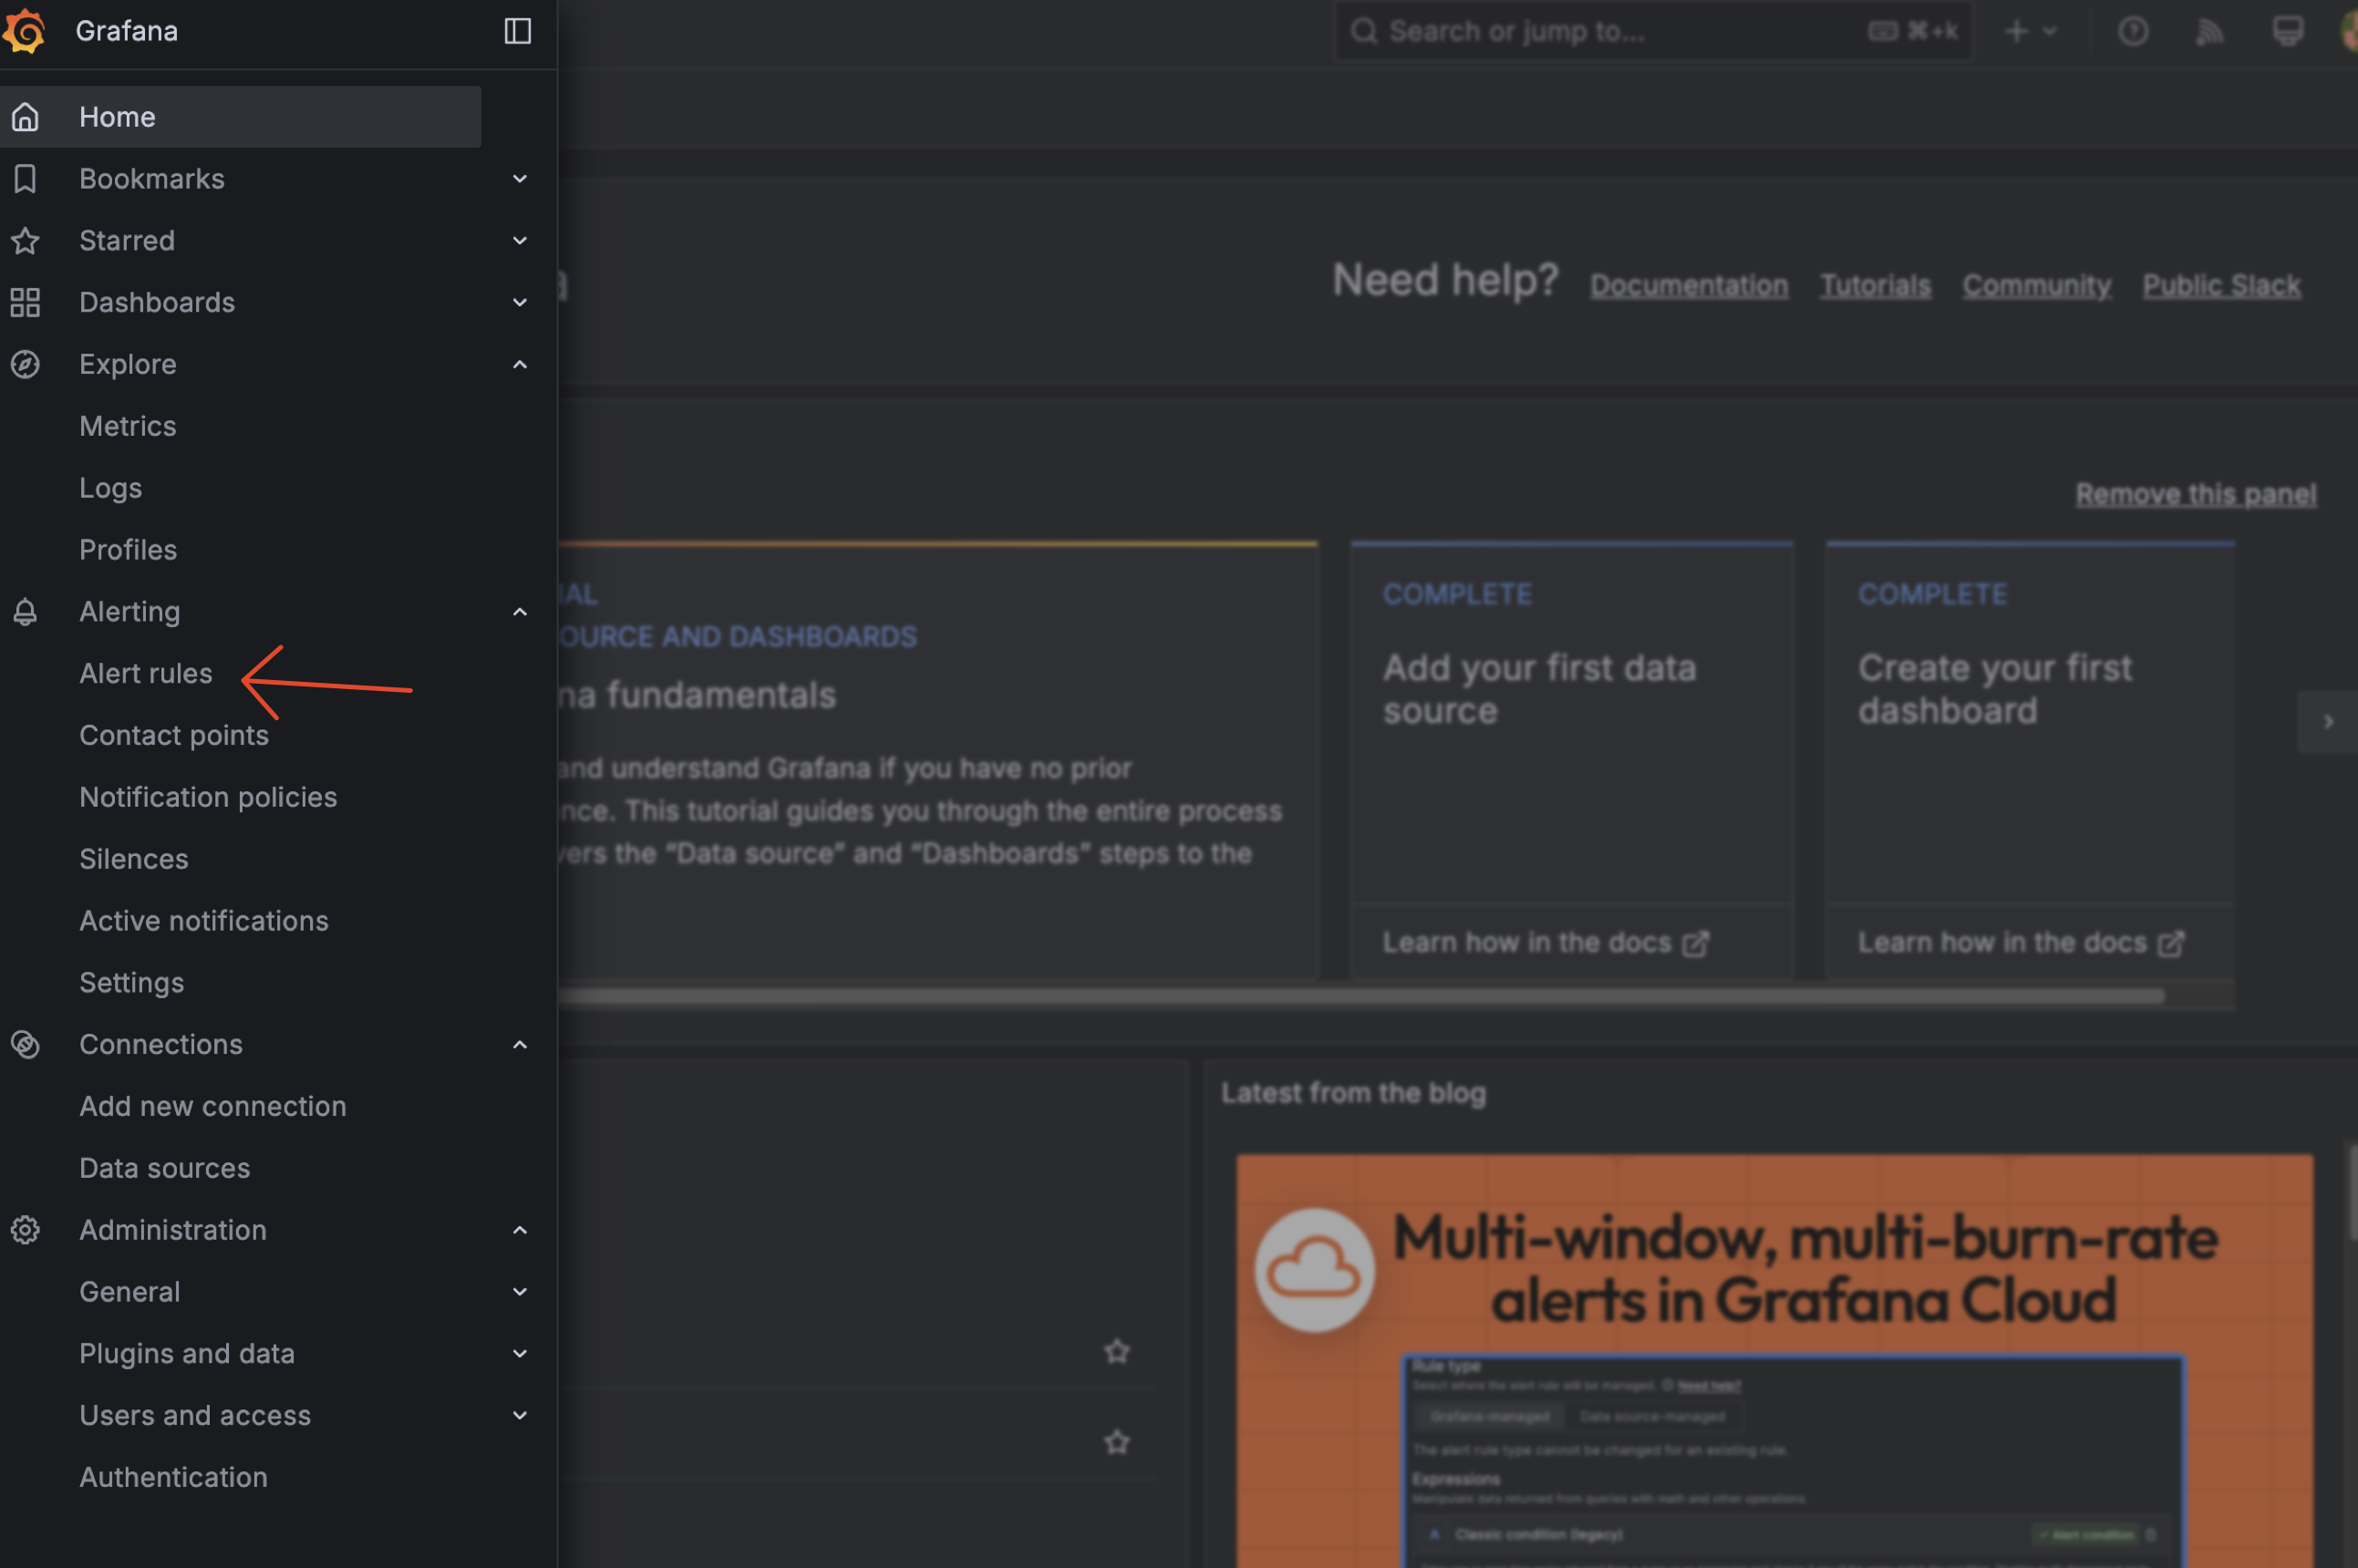
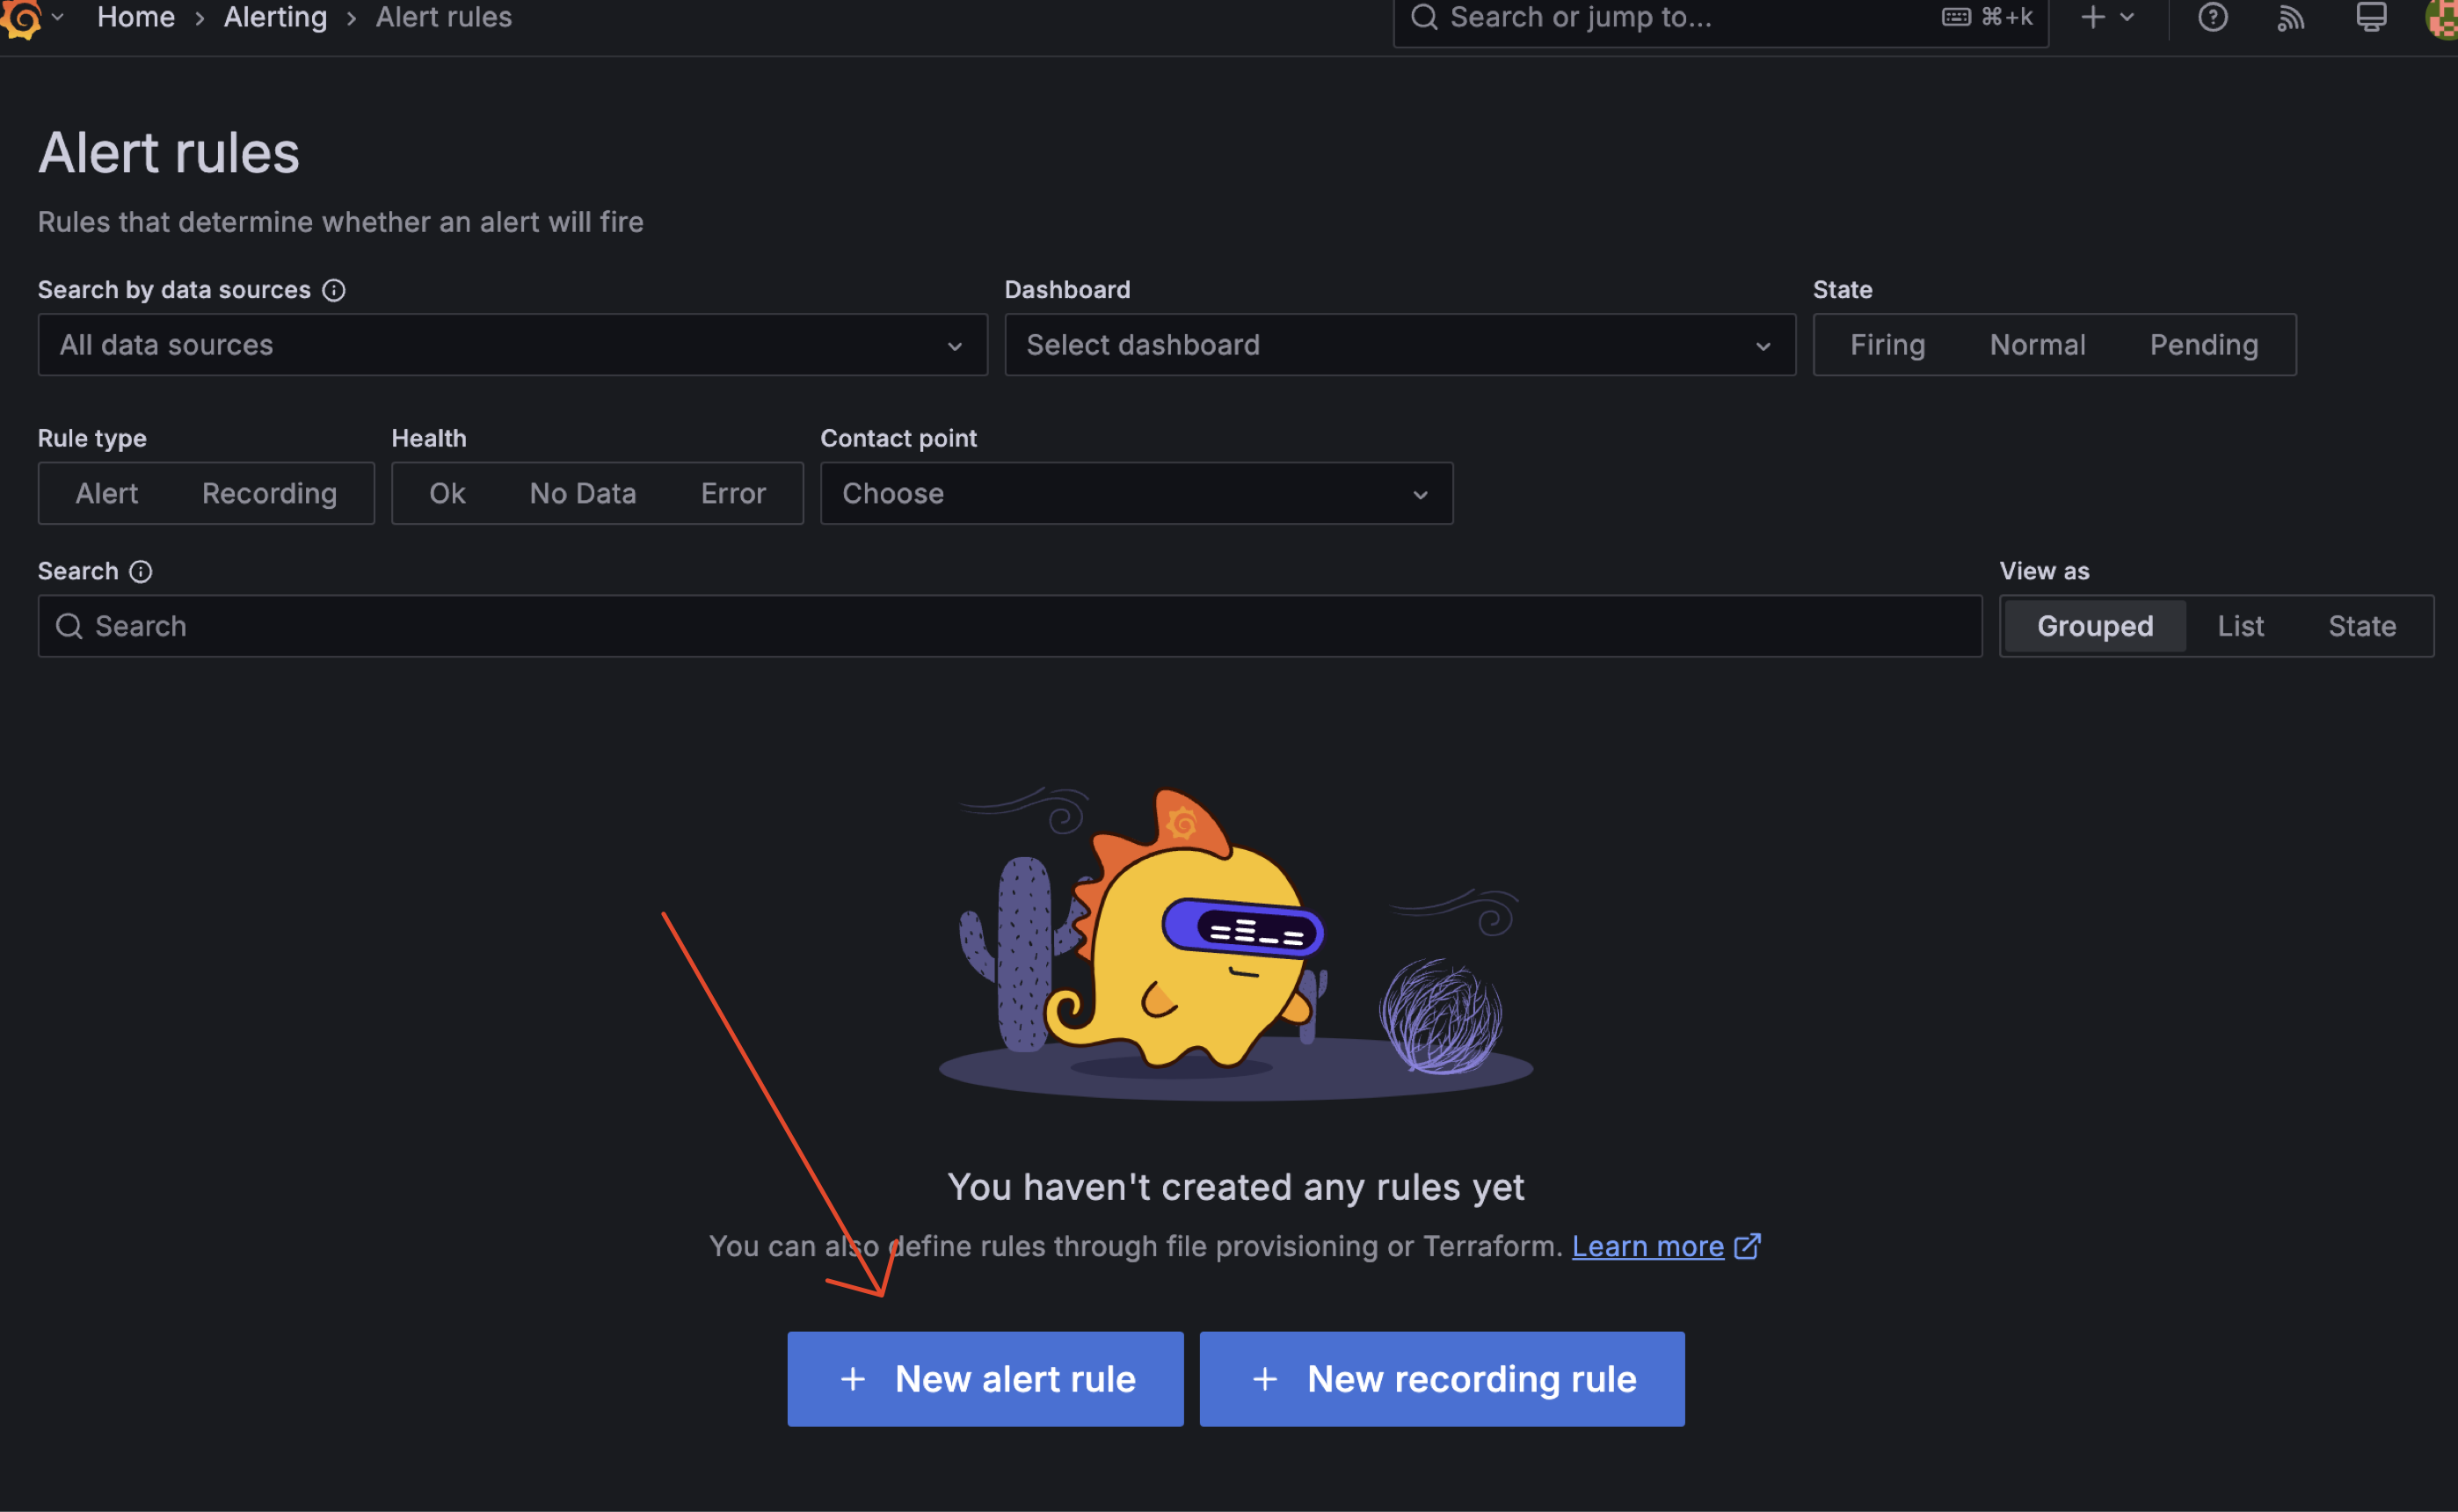
3.3.2 Create Alert Rules

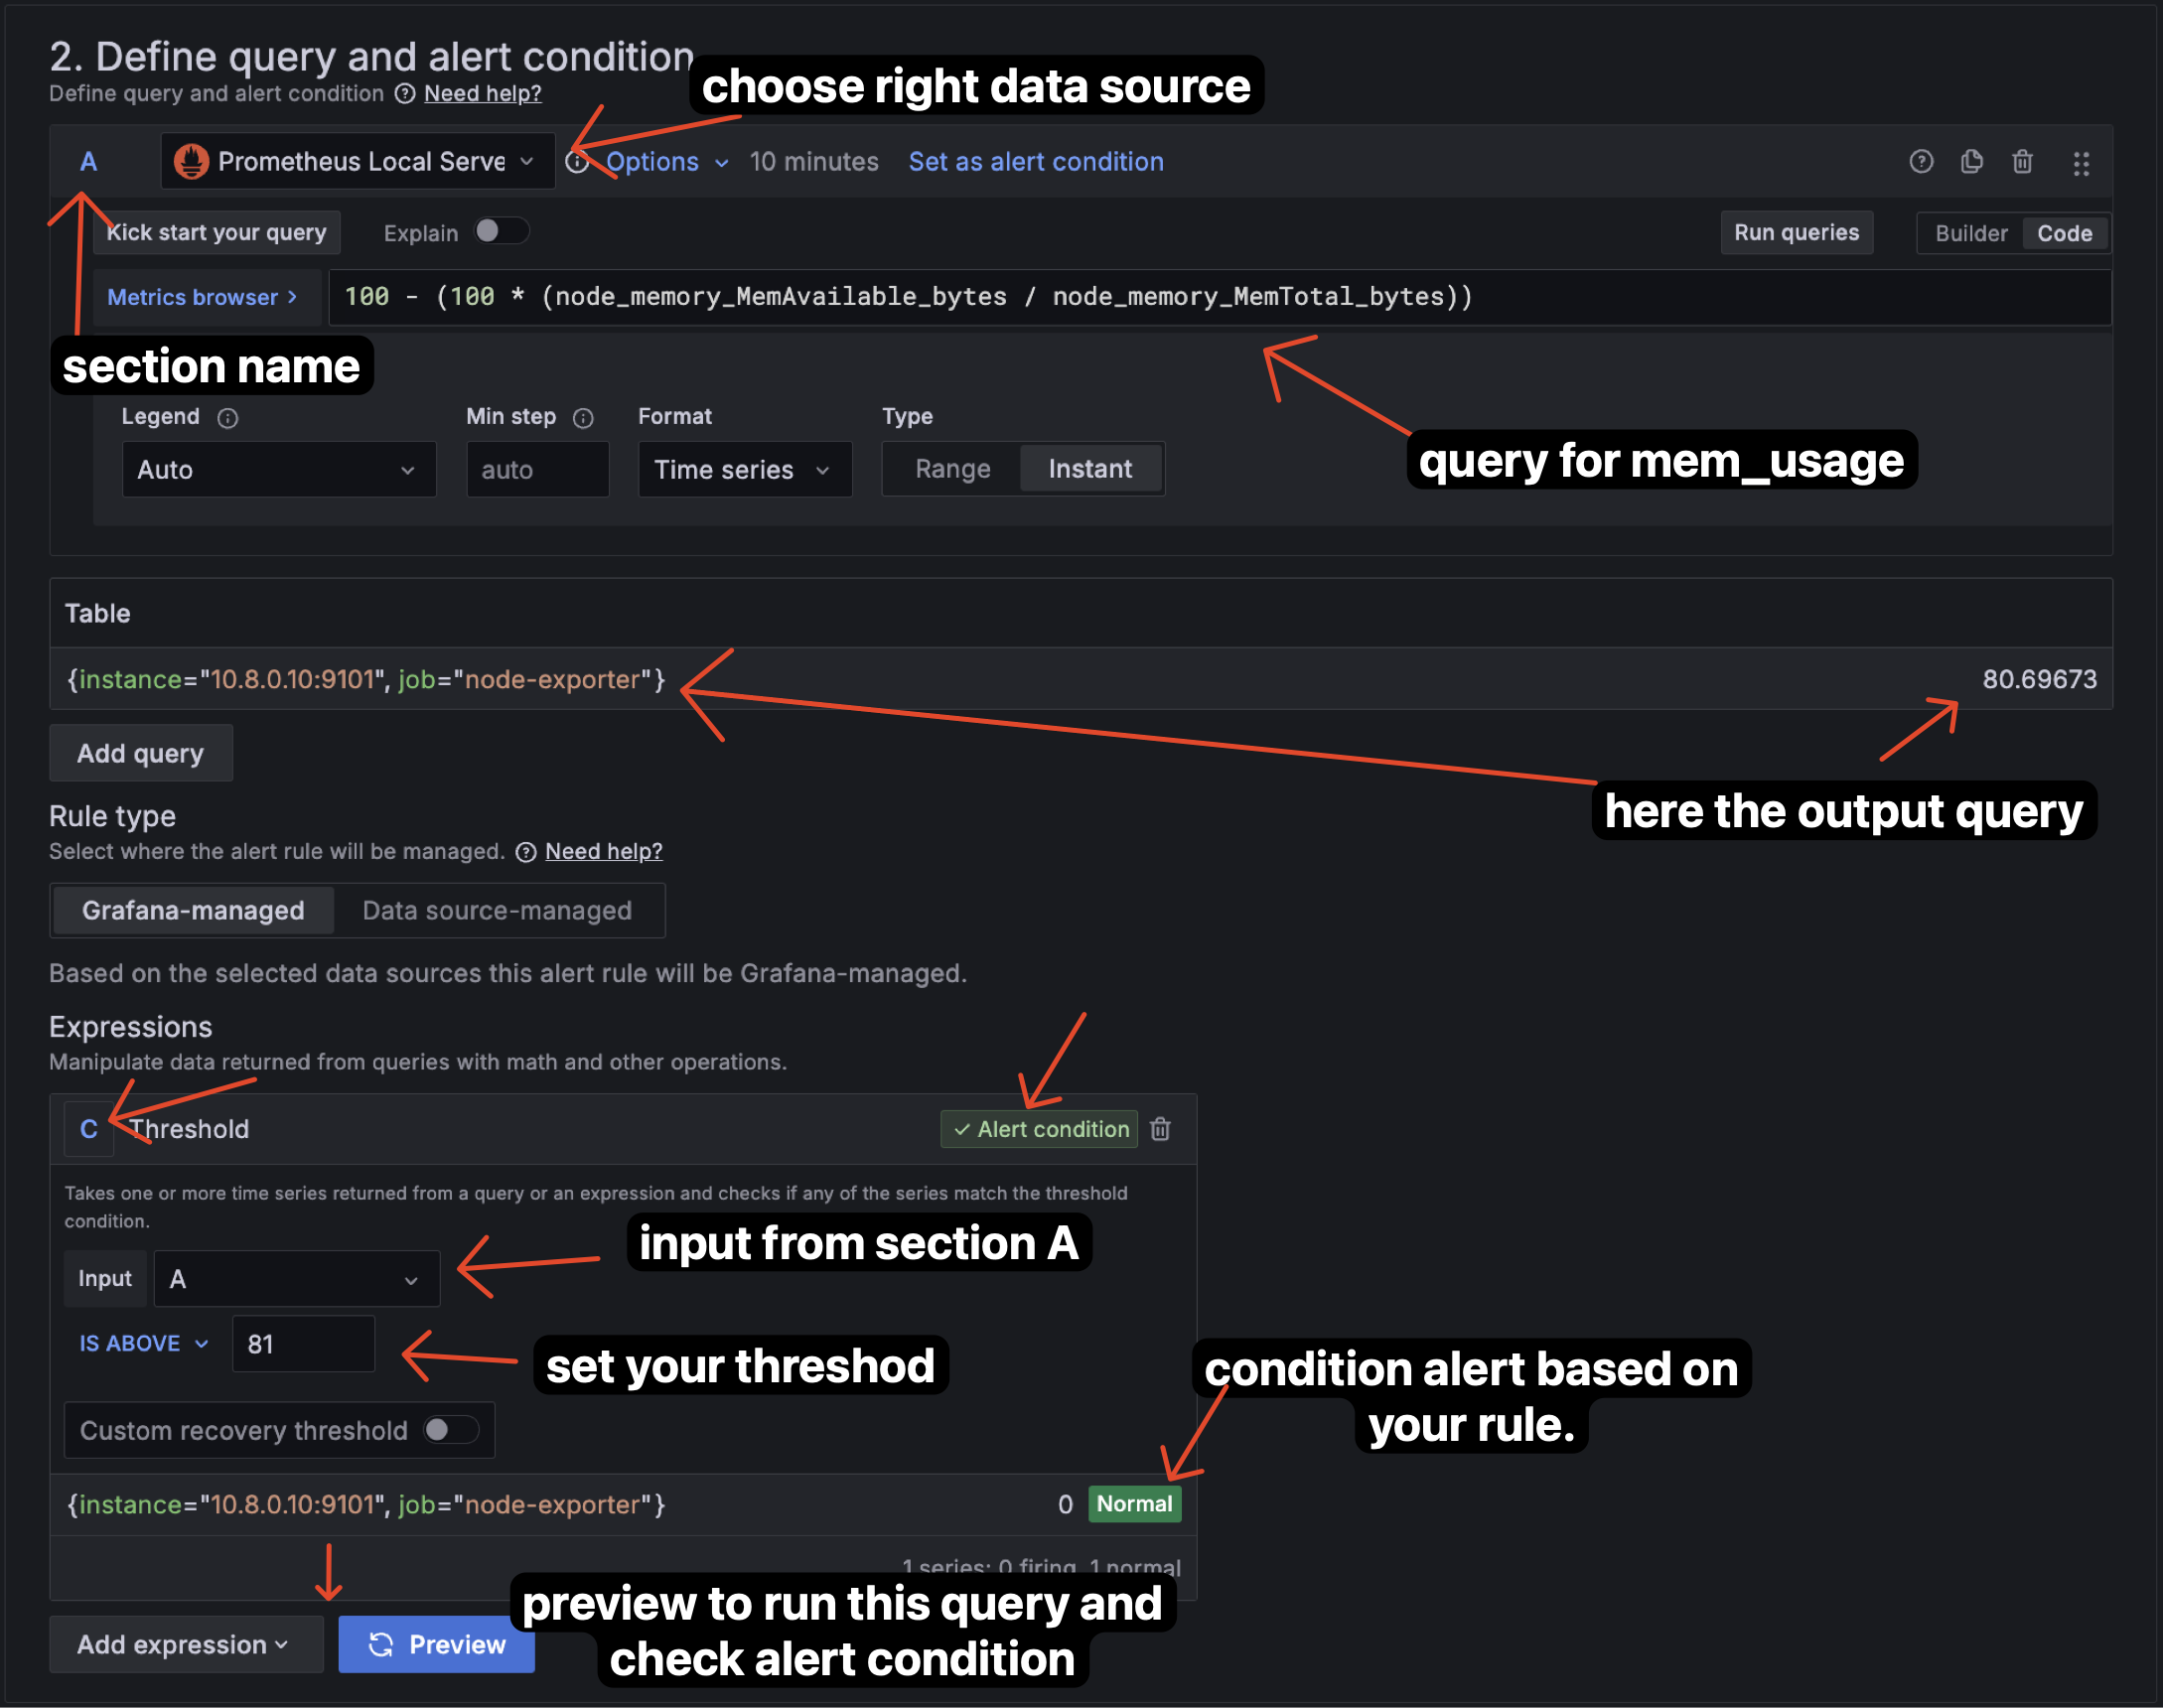
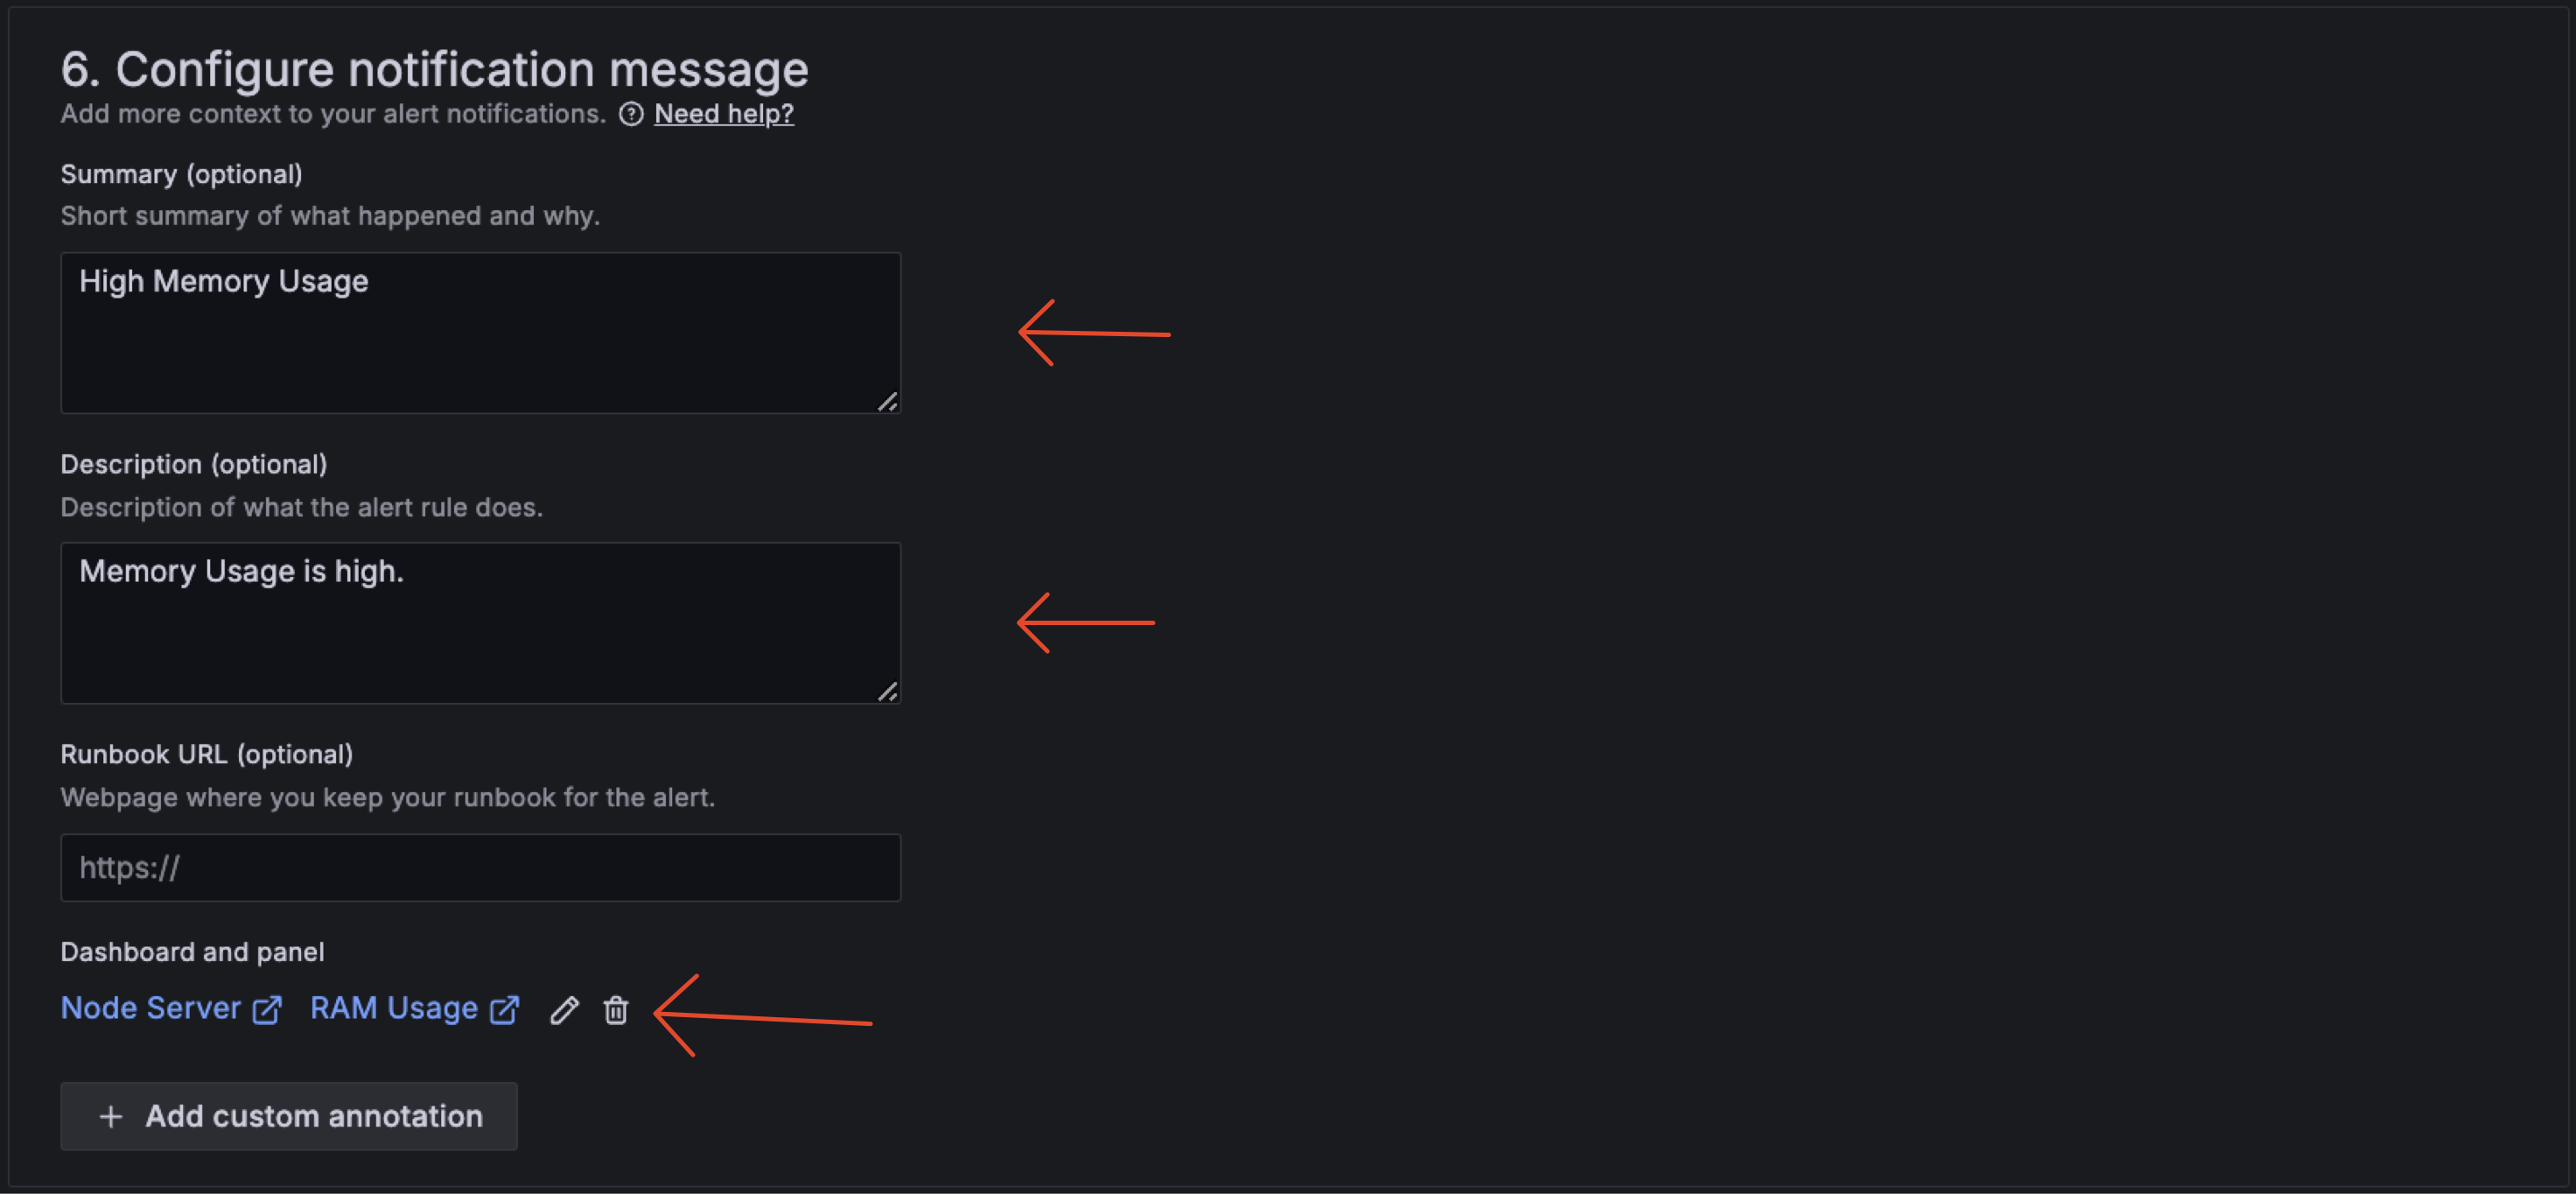
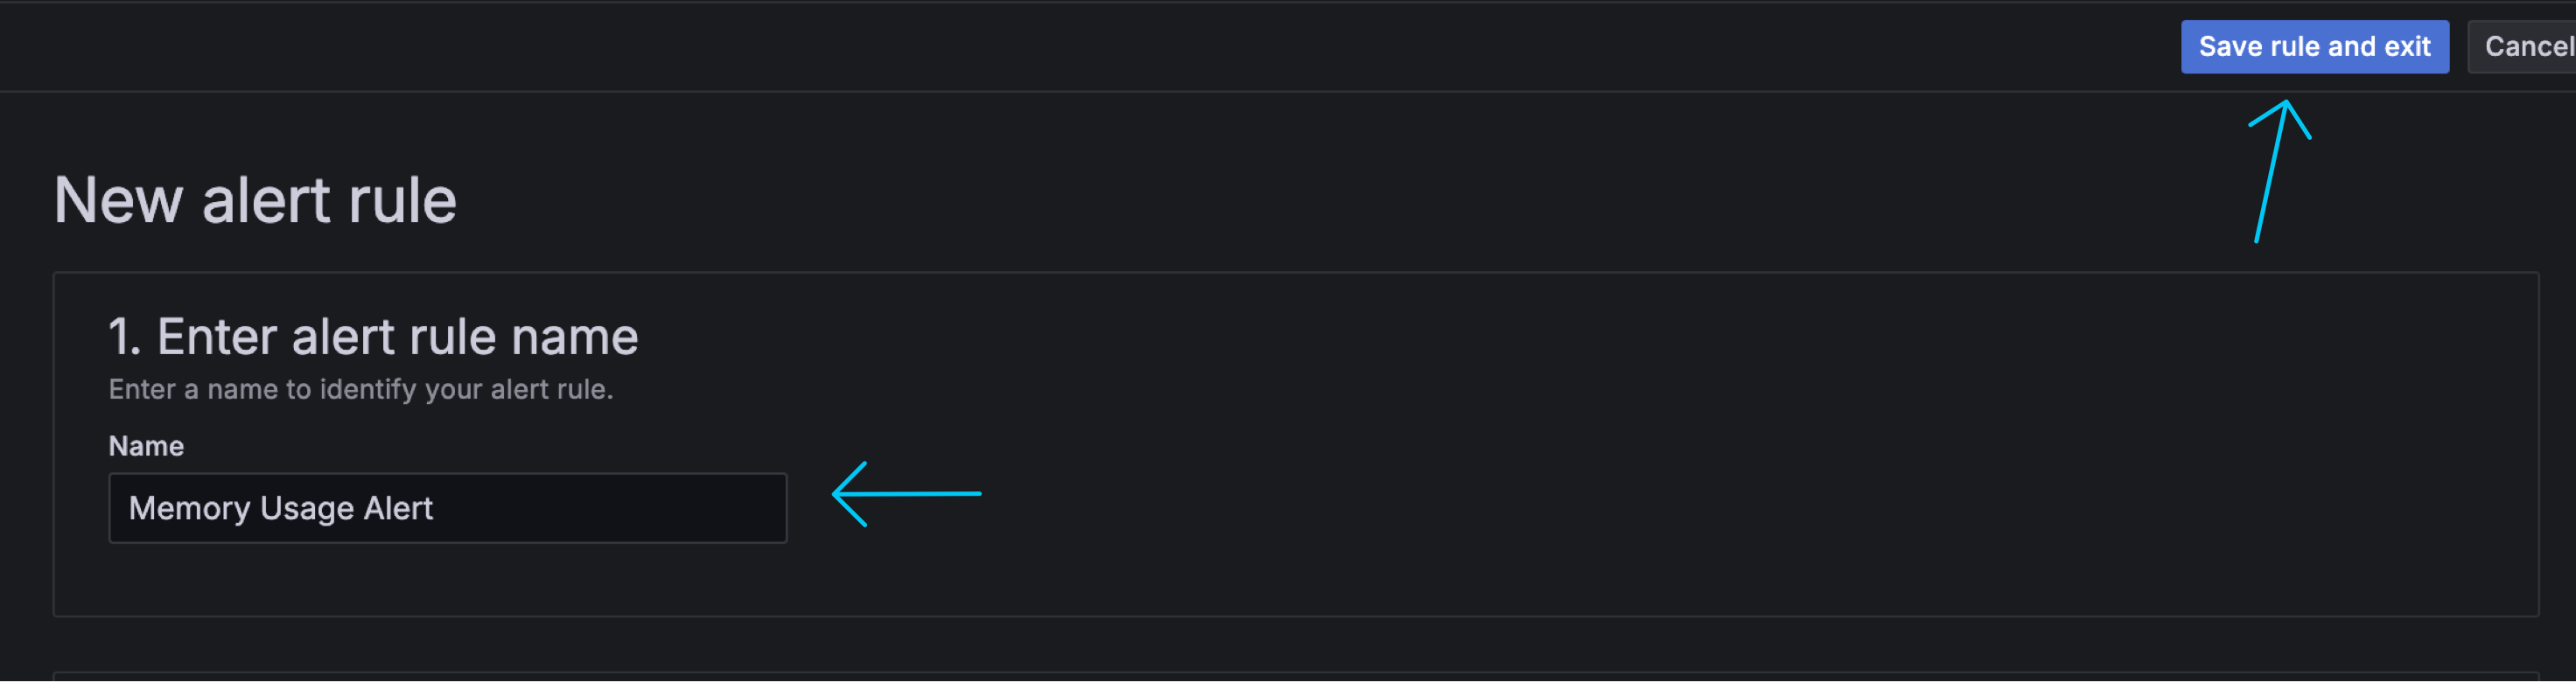
Next, we need to create alert rules. We can create alert rules by clicking on the "Alerting" tab on the left side of the dashboard and choose "Alert rules".

Step Create Alert Rules

add-datasource add-datasource add-datasource add-datasource add-datasource add-datasource

3.3.3 Result Alert

Here’s an overview of the alert we configured in Grafana based on the provided rules. The alert is designed to monitor system metrics and trigger under specific conditions. In this case, we observe the following:

  • The alert enters a firing state when the Memory usage reaches 80.5%. This occurs because the condition is set to IS_ABOVE = 80, meaning the alert activates whenever the Memory usage exceeds 80%.
  • The alert remains in a normal state for memory usage at 80.5%. This is due to the rule being set to IS_ABOVE = 81, so the alert does not trigger since the memory usage is below the defined threshold of 81%.

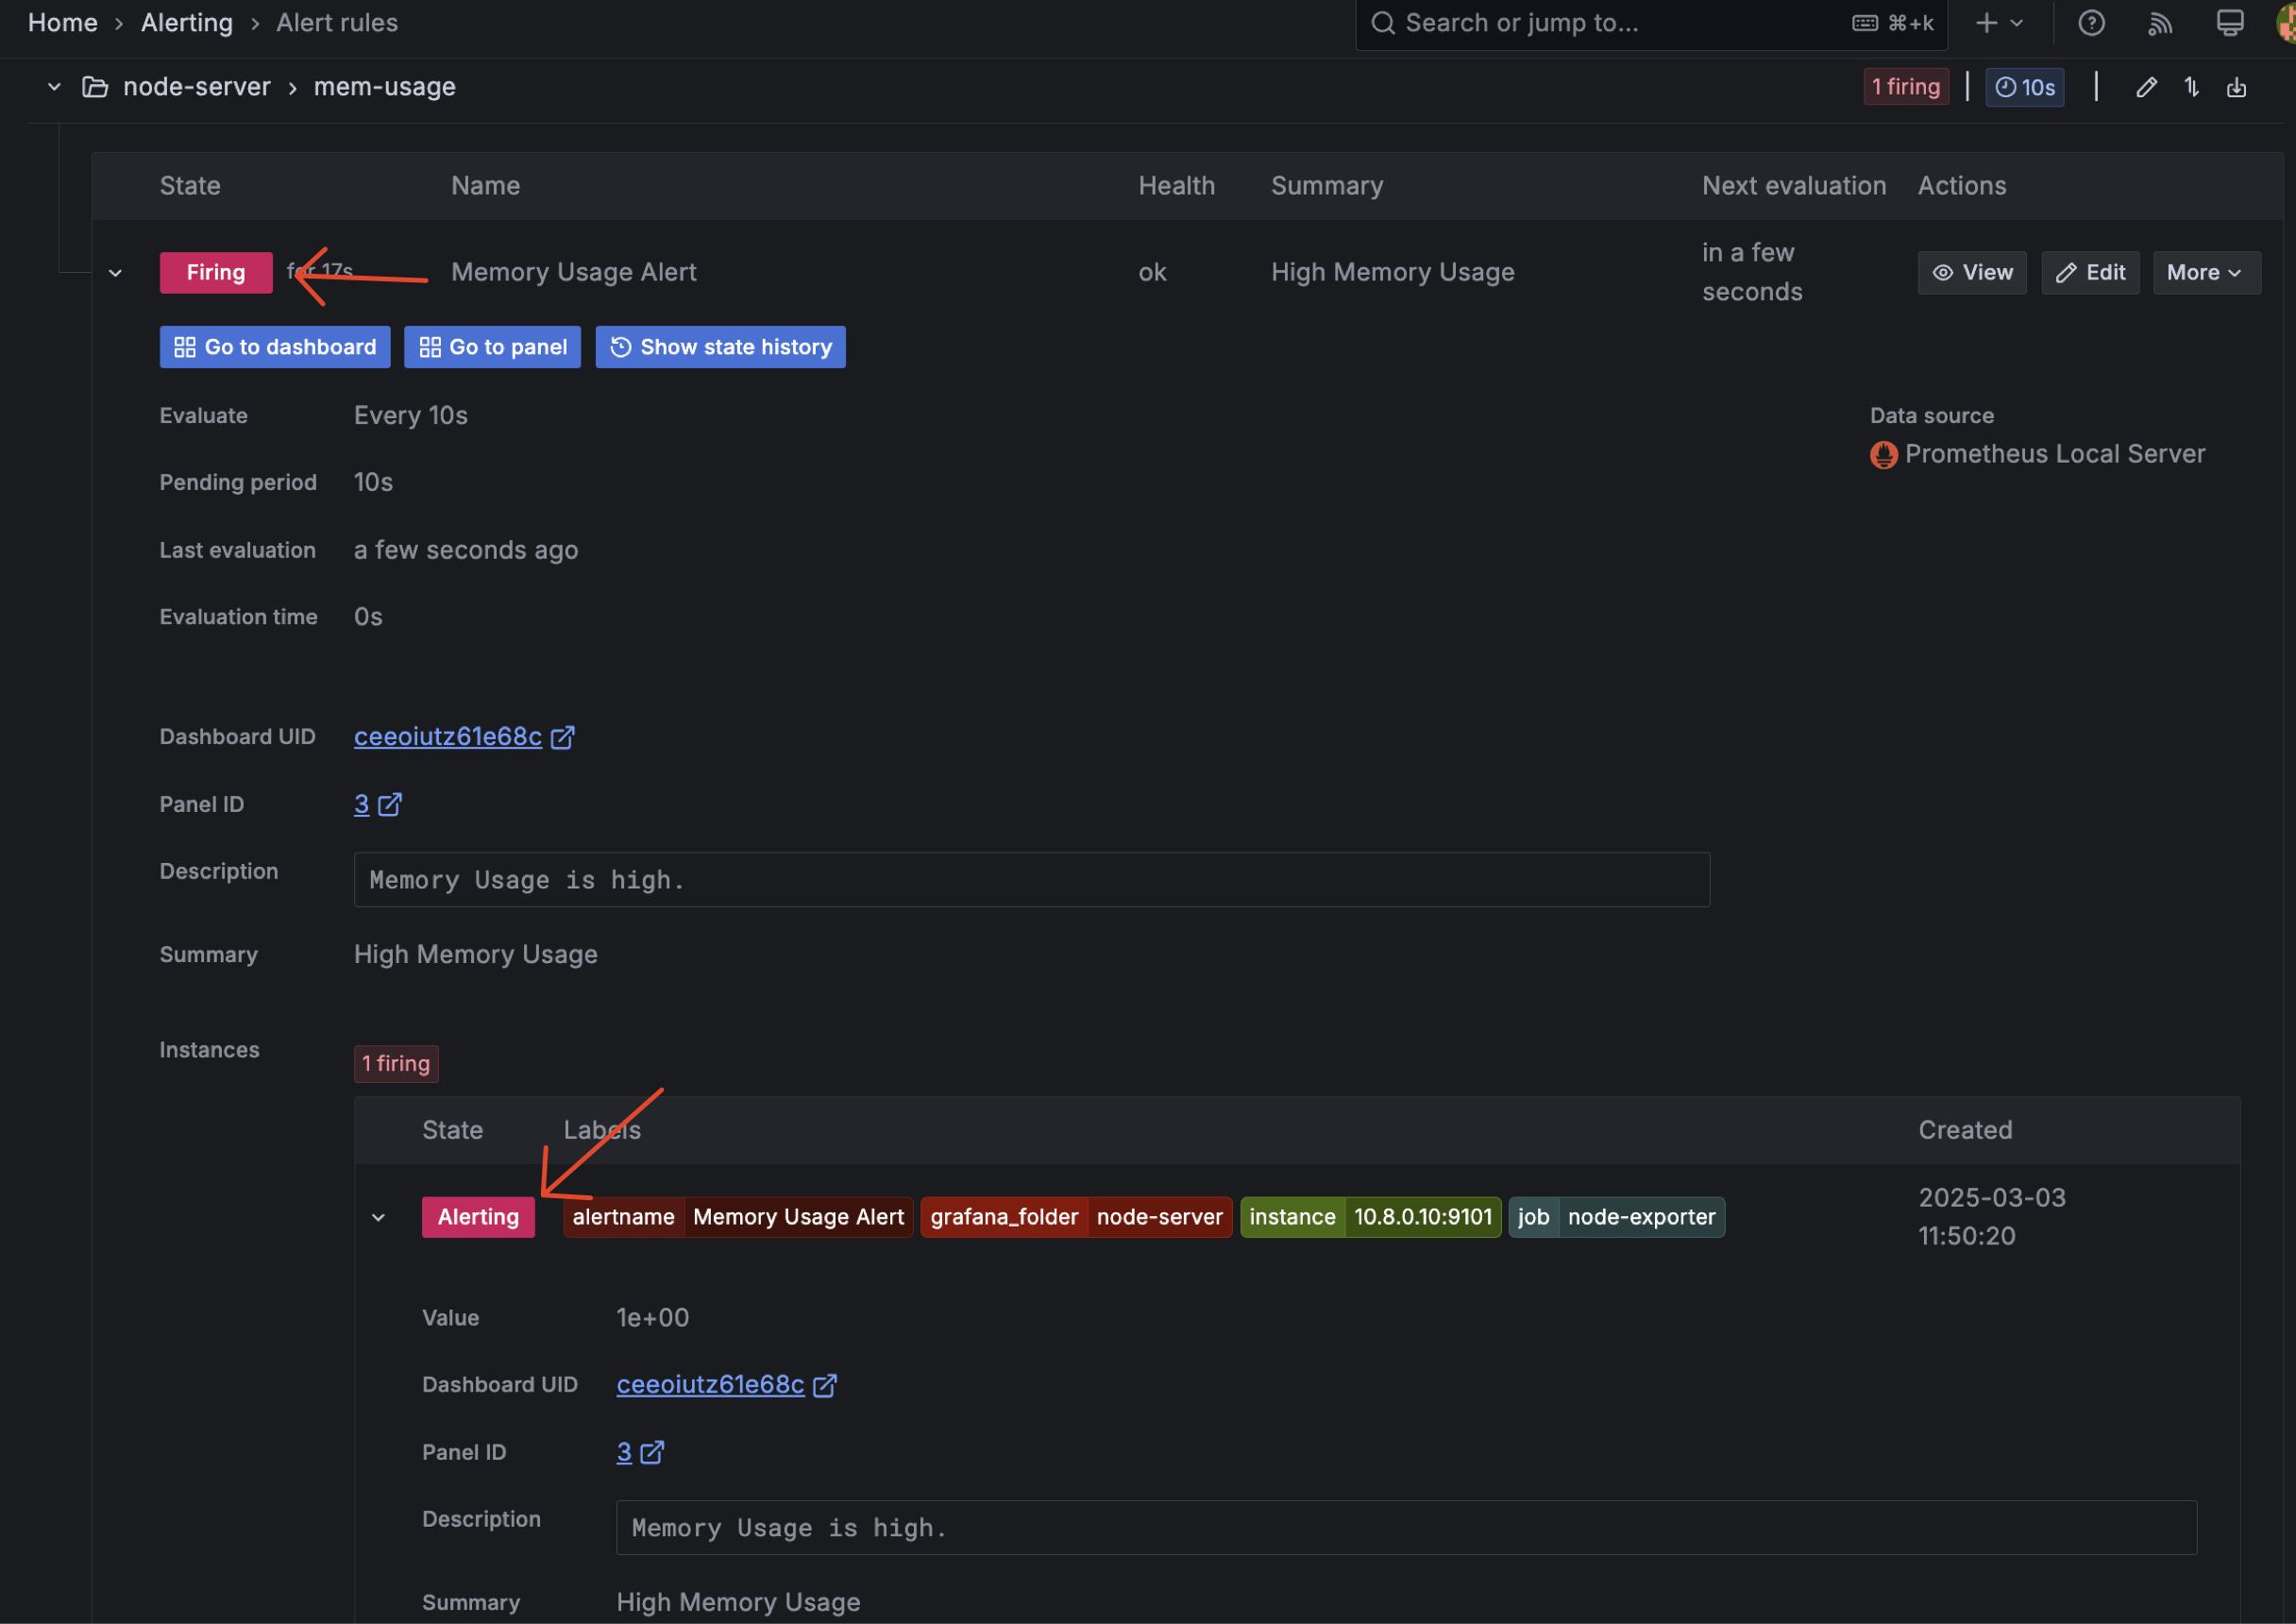
This demonstrates how Grafana evaluates the alert rules: it compares real-time metric values (e.g., CPU and memory usage) against the specified thresholds and updates the alert status accordingly (firing for active alerts and normal when conditions are not met).

Alert Capture
  1. When condition rule IS_ABOVE = 81, the alert will be in normal state because actual mem usage is 80.5% add-datasource

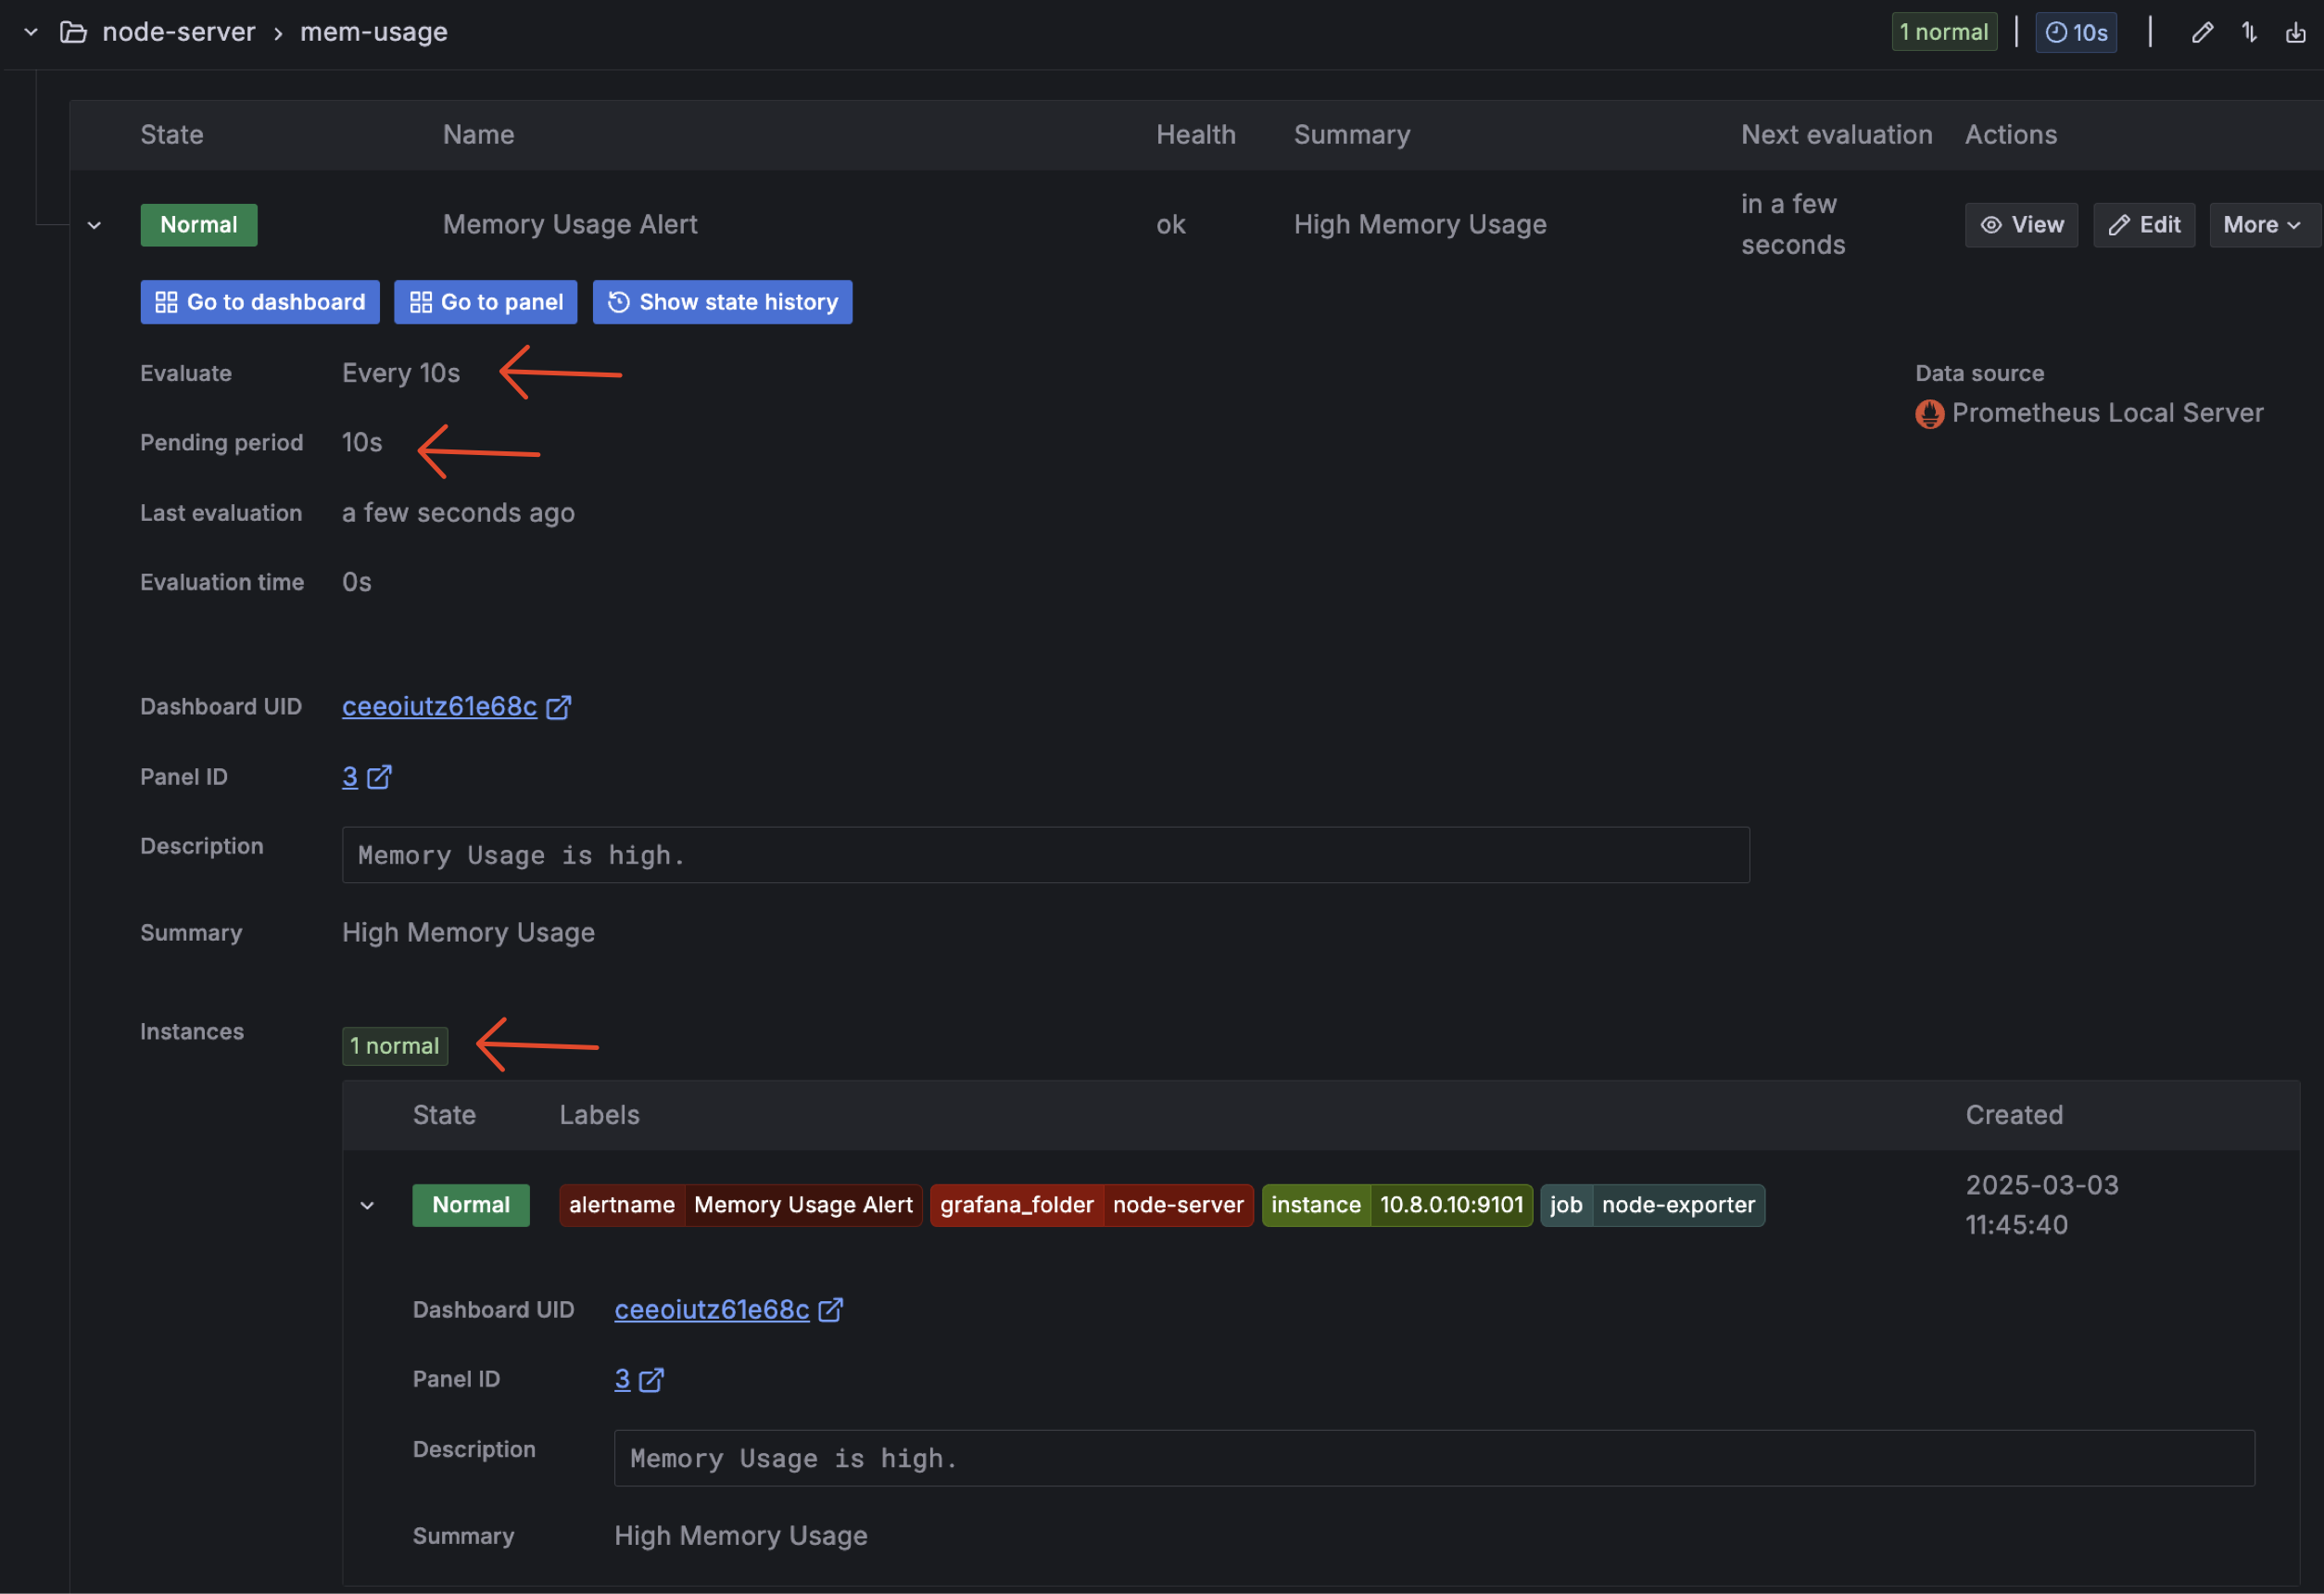
  2. When i change the condition rule from IS_ABOVE = 81 to IS_ABOVE = 80, the alert will be in firing state because actual mem usage is 80.5% add-datasource add-datasource

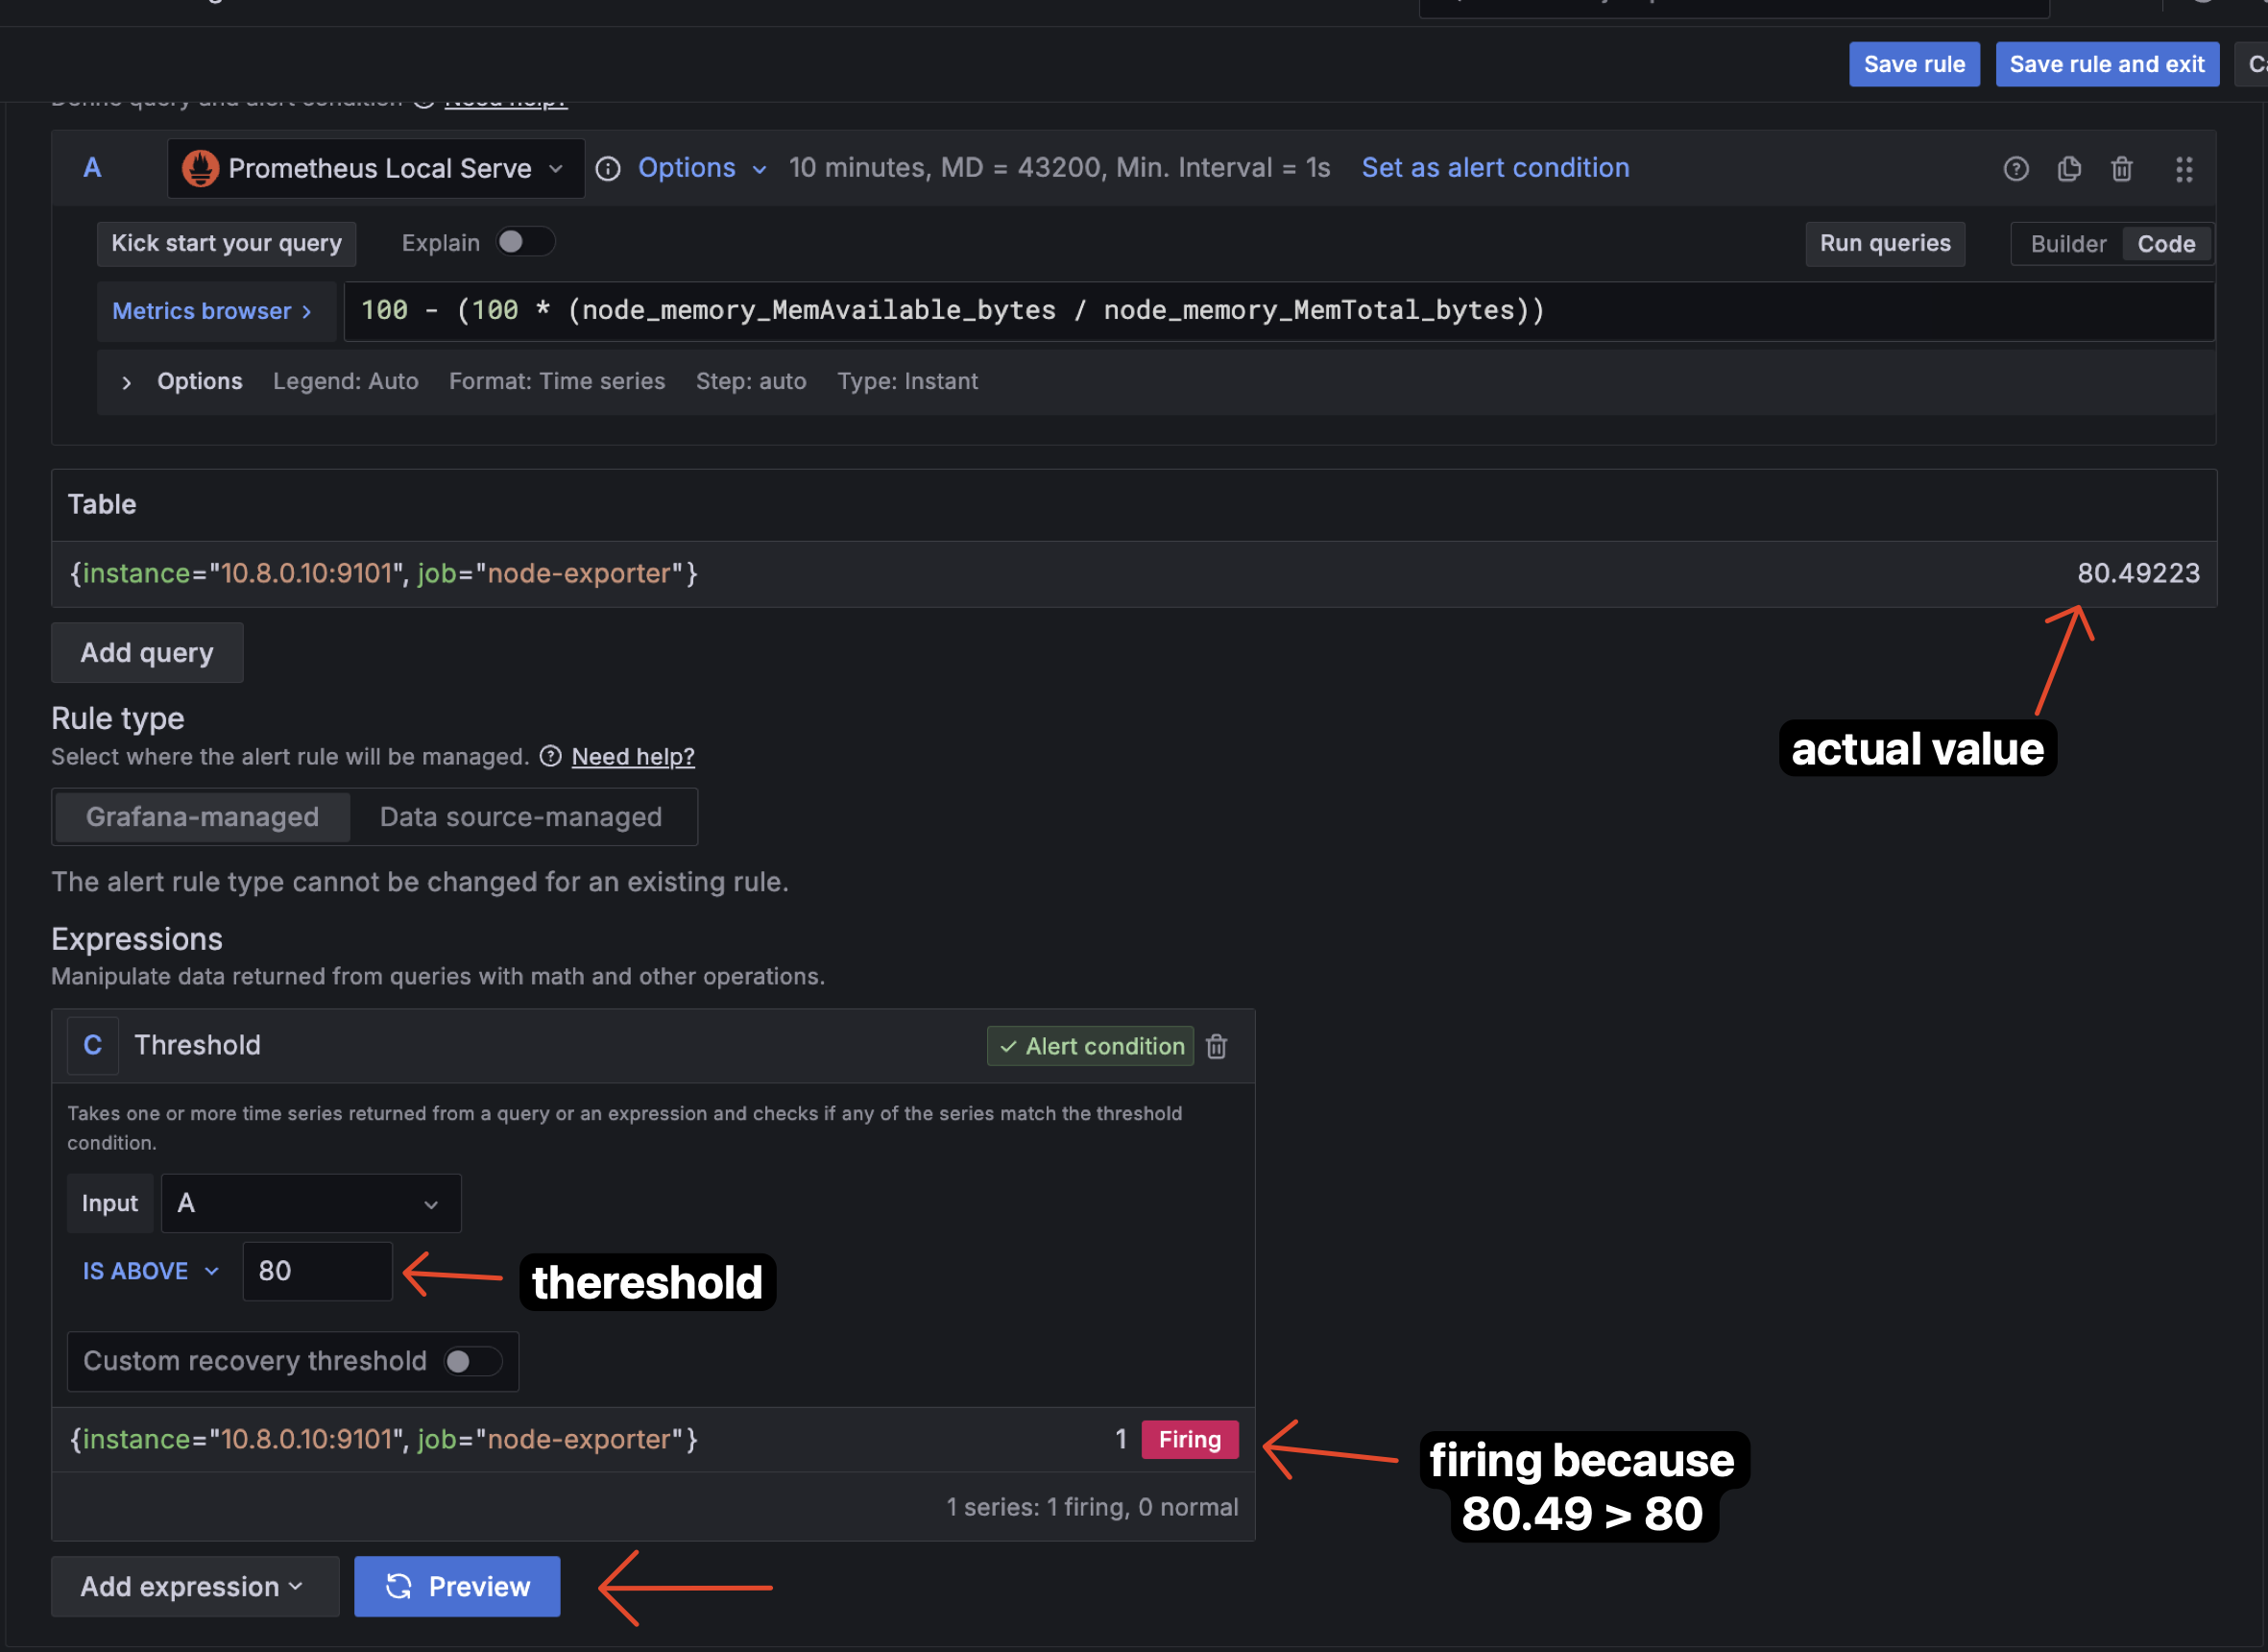
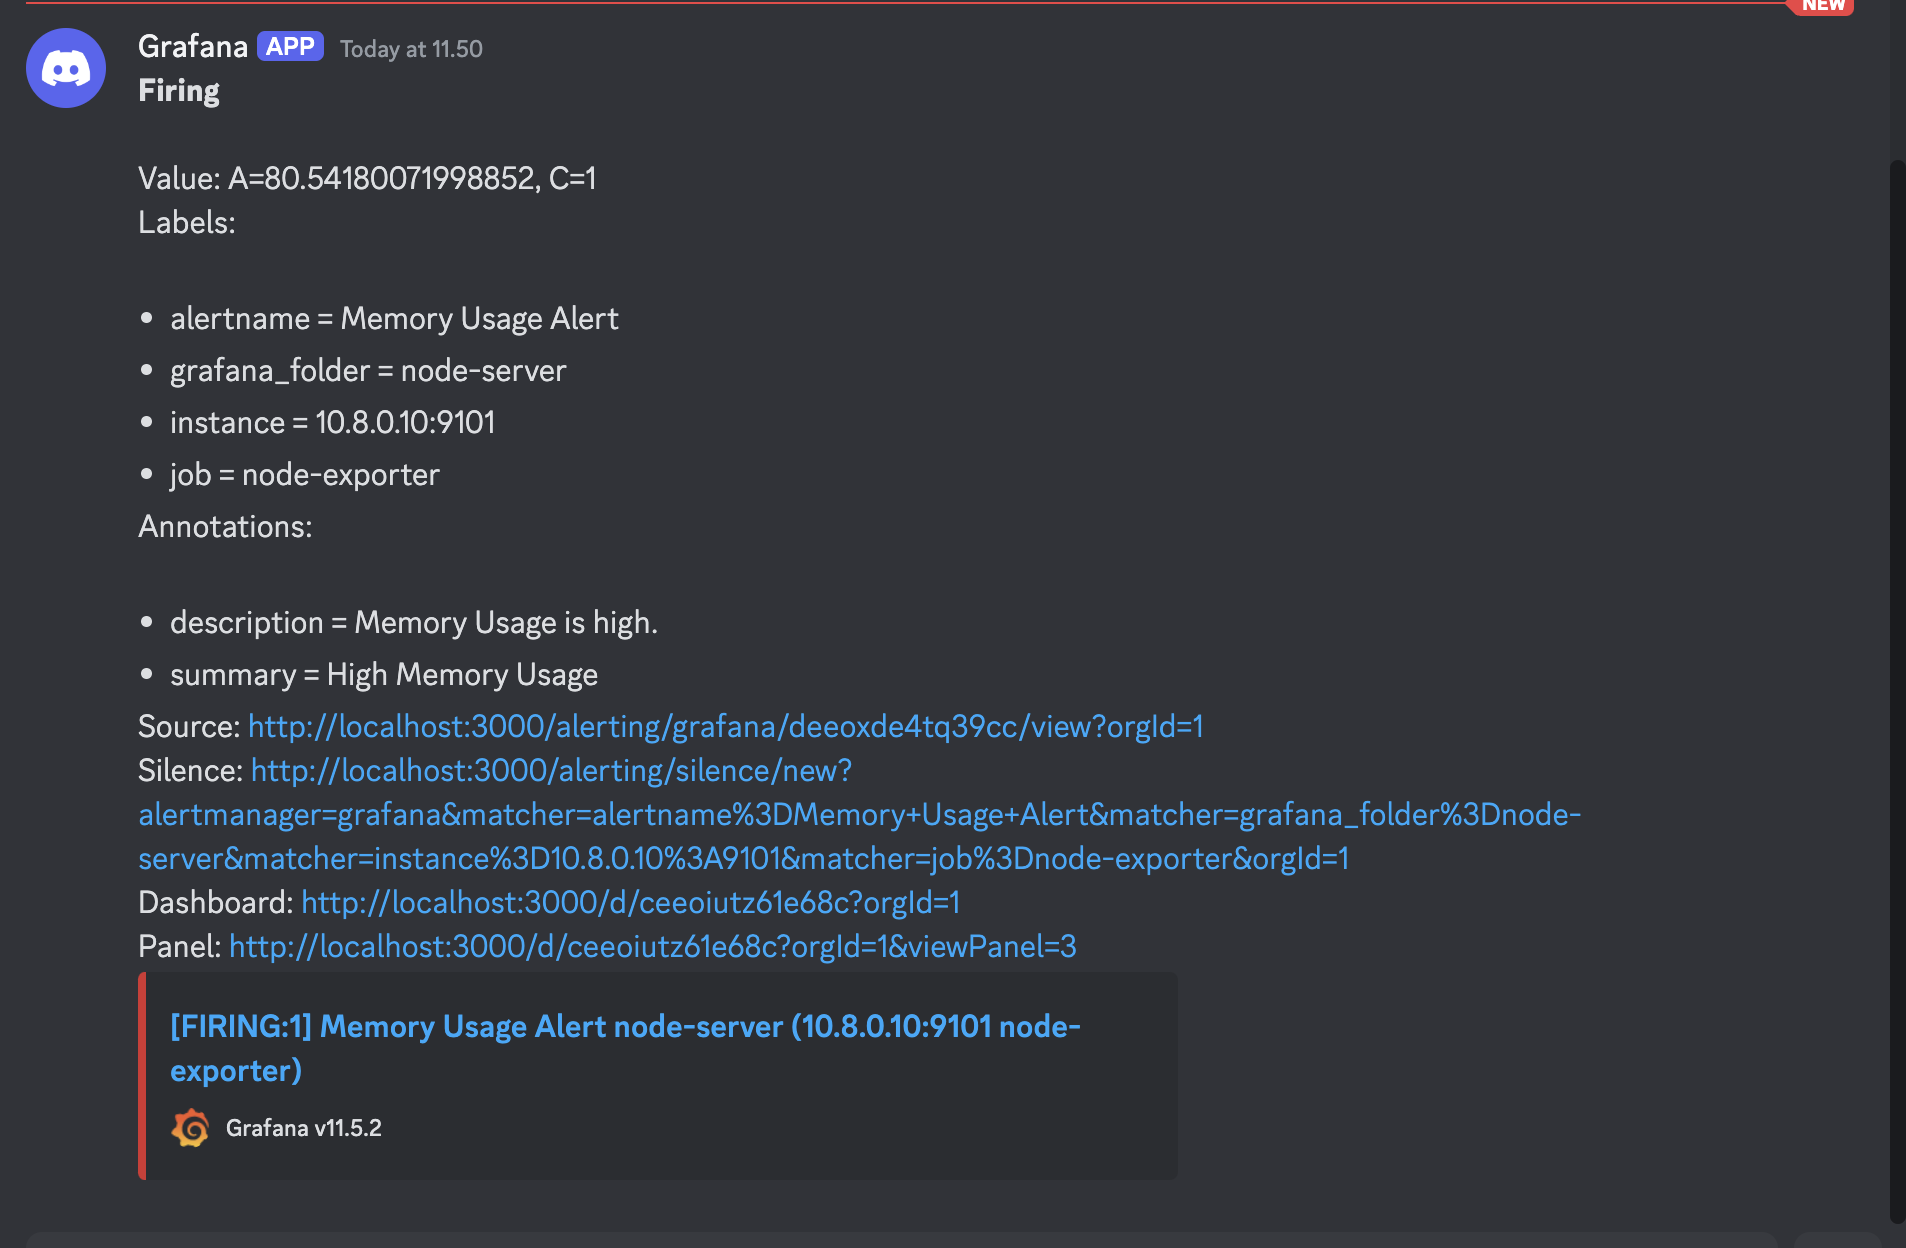
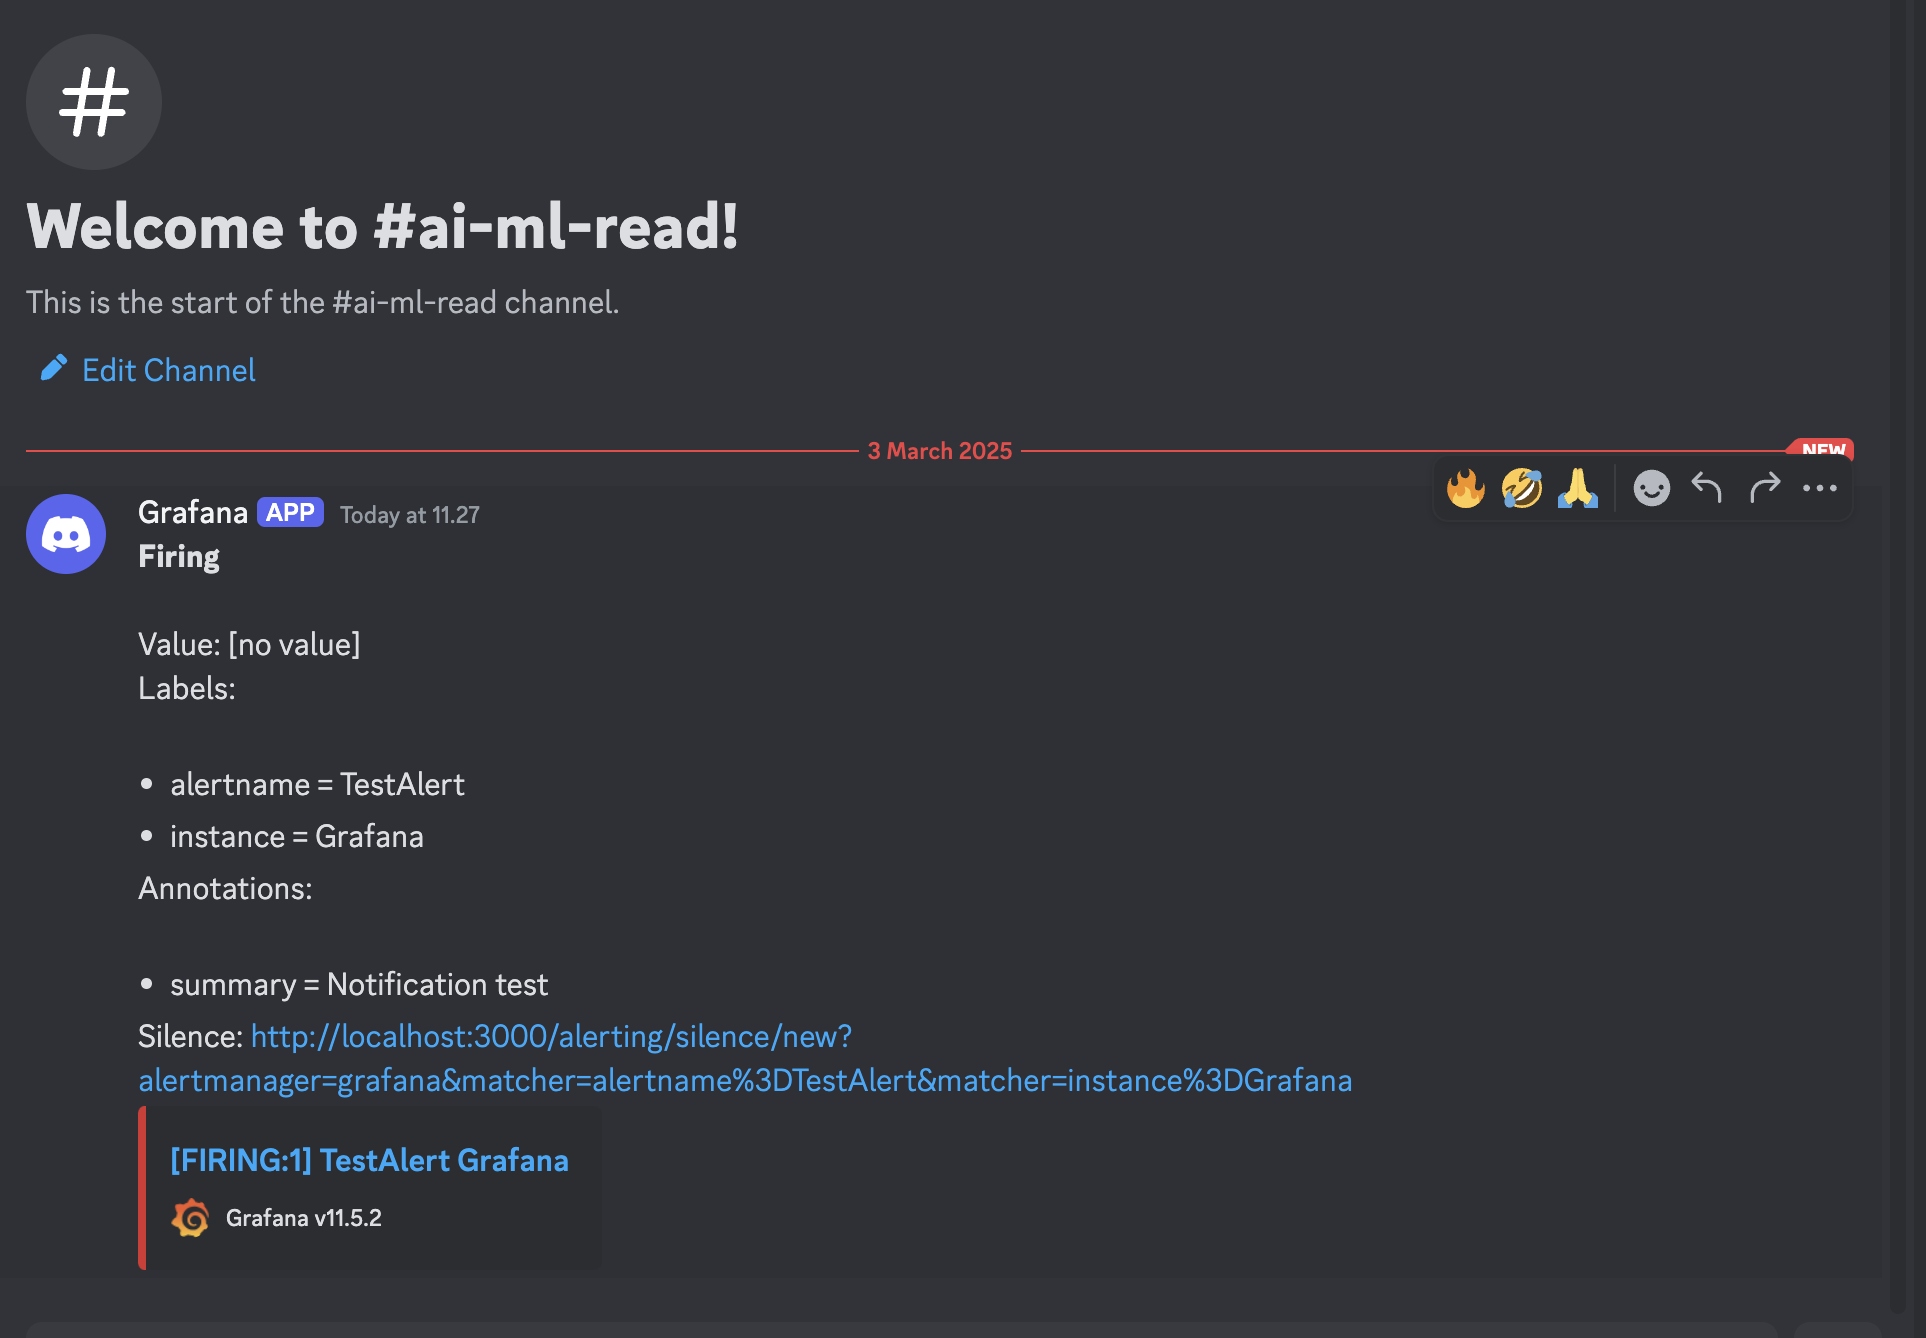
  3. Here sample message that i got in discord from the alert grafana. add-datasource

4. Conclusion

However, i cannot cover all of the features in this project, but i hope this project can help you to understand how to use prometheus and grafana for monitoring your server. Thanks for reading!

Comments