Monitoring FastAPI Applications with RED Metrics
TLDR;
RED Metrics is a set of metrics used to monitor the performance of applications/services, focusing on user experience. Not for measuring resource usage like CPU, memory, or disk utilization.
Introduction
I often build PoC (Proof of Concept) AI application using FastAPI and not yet think too much about the performance of the application. You know at that stage we just hope it works. Until finally we release it to some users, all sorts of problems pop up and we struggle to figure out what is going wrong? Is it because of resource bottleneck? How many times the endpoint is hit until it reaches the bottleneck? Or is there something wrong with our code? This makes it difficult to control because we don't know what is the problem.
One way to control the performance of the application is to measure the performance of the application. As my teacher said, "If we can't measure it, we can't manage it"
There are many ways to measure the performance of our application, one of them is by using RED Metrics.
What is RED Metrics?
RED metrics provide a user-centric view of your application's performance. The acronym RED stands for:
- Rate: How many requests your application is receiving per unit of time (Request Rate).
- Errors: How many of those requests are failing (Failed Requests).
- Duration: How long it takes to process a request (Latency).
Quote
"The RED Method is a good proxy to how happy your customers will be. If you’ve got a high error rate, that’s basically going through to your users and they’re getting page load errors. If you’ve got a high duration, your website is slow. So these are really good metrics for building meaningful alerts and measuring your SLA”
- Tom Wilkie - Grafana Labs
Unlike metrics that focus on CPU, memory, or disk usage, RED metrics are all about the user experience. They help you understand how your application is performing from the user's perspective, which is crucial for ensuring a smooth and reliable experience.
What is the Benefit of RED Metrics?
RED metrics help monitor the health of your application by providing insights into its performance. Monitoring is essential for:
- Detecting issues early.
- Analyzing performance bottlenecks.
- Making informed decisions, such as scaling resources or improving error handling.
How it Works?
Prometheus and Grafana are two popular open-source tools used for monitoring and visualization. They work together to provide a comprehensive monitoring solution. This system has 3 main components:
- Application: The application exposes metrics at the
/metricsendpoint. - Prometheus: A time series database that scrapes the result of
/metricsendpoint every 15 seconds (default, yeah you can configure it but will come with some trade off). - Grafana: A visualization tool that queries Prometheus and displays the metrics on a dashboard. You can build type of graph/chart you want.
sequenceDiagram
    participant App as Application<br><br>GET /metrics
    participant Prom as Prometheus
    participant Graf as Grafana

    Note over App,Graf: Maximum Latency: ~15-45 seconds from new metric to dashboard

    loop Every Scrape (15s)
        App->>Prom: Expose metrics
        Note over App,Prom: Prometheus scrapes <br>/metrics every 15s
    end

    loop Every dashboard refresh (5-30s)
        Graf->>Prom: Request update
        Prom->>Graf: Return data
        Note over Prom,Graf: Dashboard refresh interval set in<br>Grafana UI: Dashboard Settings > Time Options
    end
For short, the service expose endpoint GET /metrics and prometheus side will have configuration to scrape the endpoint every 15 seconds, and then grafana will query the prometheus every 5-30 seconds and you can see the metrics on the grafana dashboard. So the latency is around 15-45 seconds from new metric to dashboard.
For more details what inside the prometheus and grafana, please see the sequence diagram below:
More Details
Sequence Diagram
sequenceDiagram
    participant App as Application<br><br>GET /metrics
    participant Scr as Prometheus<br><br>Scraper
    participant TSDB as Prometheus<br><br>TimeSeriesDB
    participant PE as Prometheus<br><br>PromQL Engine
    participant DS as Grafana<br><br>Datasource
    participant QP as Grafana<br><br>Query Panel
    participant U as Grafana<br><br>Dashboard

    Note over App,U: Maximum Latency: ~15-45 seconds from new metric to dashboard

    loop Every Scrape (15s)
        App->>Scr: Expose metrics
        Note over App,Scr: Prometheus scrapes <br>/metrics every 15s
        Note over App,Scr: Config:<br>prometheus.yml (scrape_interval)

        Scr->>TSDB: Store metrics
        Note over Scr,TSDB: Stores as time series<br> with timestamps & labels
    end

    loop Every dashboard refresh (5-30s)
        QP->>DS: Request update
        DS->>PE: Send PromQL query
        PE->>TSDB: Fetch data
        TSDB-->>PE: Return time series
        PE-->>DS: Return processed data
        DS-->>QP: Return formatted data
        QP-->>U: Update visualization
        Note over QP,U: Dashboard refresh interval set in<br>Grafana UI: Dashboard Settings > Time Options
    end
How to Implement RED Metrics on FastAPI?
⤷ Install the Required Libraries
Note
Prerequisite:
- know what is middleware in FastAPI
⤷ prometheus-client
Prometheus create a library for clients to instrument, and its ready in many languages, including Python. In this article we will use prometheus-client for Python. In this post we will try to implement 3 instrumenting tools:
-
Counter:
- A counter is a cumulative metric that represents a single numerical value that only counter up (increase). It can be reset to zero on restart.
- Use a Counter to count requests, errors, or any other event that should only increase.
-
Histogram:
- A histogram samples observations (usually things like request durations or response sizes) and counts them in configurable buckets. The histogram is a powerful tool for measuring the distribution of values. Based on documentation, it use cumulative histogram to measure the duration of requests.
- Use a Histogram to measure the duration of requests, response sizes, etc.
Example Case
- For example case measure the duration of requests. We can set of buckets to measure the duration of requests and can set for example:
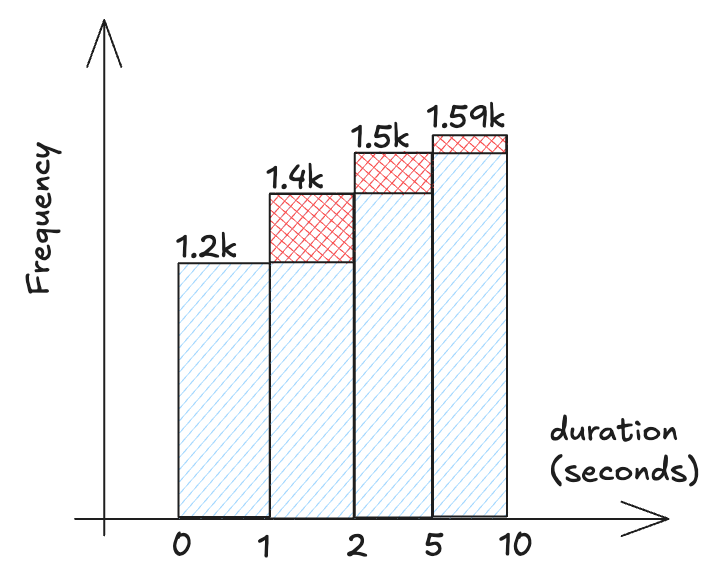
- The buckets set like this:
Bucket Description ≤ 1 second Very Fast (requests completed in 1 second or less) ≤ 2 seconds Fast (requests completed in 2 seconds or less) ≤ 5 seconds Moderate (requests completed in 5 seconds or less) ≤ 10 seconds Slow (requests completed in 10 seconds or less) - Example case request:
Request Duration (seconds) A 0.8 B 1.5 C 1.7 D 2.5 E 7.5 - So the prometheus will make the buckets like this:
Bucket Count Requests ≤ 1 second 1 A ≤ 2 seconds 3 A, B, C ≤ 5 seconds 4 A, B, C, D ≤ 10 seconds 5 A, B, C, D, E -
Gauge:
- A gauge is a metric that represents a single numerical value that can go up and down.
- Use a Gauge to measure the number of active requests, memory usage, cpu usage, etc.
⤷ Implementing RED Metrics Middleware using prometheus-client
We will create middleware class to handle the metrics collections. Middleware allow us to apply metrics collection to all endpoints in a centralized class, without needing to instrument each endpoint individually.
We can implement this efficiently by inheriting from BaseHTTPMiddleware class. BaseHTTPMiddleware is a Starlette class that allows us to intercept and process requests and responses. By overriding the dispatch method, we can add custom logic to collect metrics before and after the request is processed. By leveraging middleware, we can ensure that our metrics collection is consistent and efficient across all endpoints.
We will implement 4 metrics:
REQUEST_COUNTER: Counter to count the total number of requests.REQUEST_LATENCY: Histogram to measure the duration of requests.ERROR_COUNTER: Counter to count the total number of errors (4xx-5xx).ACTIVE_REQUESTS: Gauge to measure the number of active requests.
# middleware_metrics.py

from prometheus_client import Counter, Histogram, Gauge

REQUEST_COUNTER = Counter(
    name="http_requests_total", # (1)
    documentation="Total count of HTTP requests", # (2)
    labelnames=["method", "status_code", "path", "service"], # (3)
)

REQUEST_LATENCY = Histogram(
    name="http_request_duration_seconds",
    documentation="HTTP request latency in seconds",
    labelnames=["method", "status_code", "path", "service"],
    buckets=( # (4)
        # Set this based on your SLA
        # If your SLA is 99.9% requests under 300ms
        # Excellent
        0.005, 0.01, 0.025, 0.05, 0.075,
        # Good
        0.1, 0.25,
        # Moderate
        0.5, 0.75,
        # Poor
        1.0, 2.5, 5.0, INF,
    ),
)

ERROR_COUNTER = Counter(
    name="http_errors_total",
    documentation="Total count of HTTP errors (4xx-5xx)",
    labelnames=["method", "status_code", "path", "service"],
)

ACTIVE_REQUESTS = Gauge(
    name="http_requests_active",
    documentation="Number of currently active HTTP requests",
    labelnames=["method", "path", "service"],
)
name: This is like naming a variable. We can use this name toquerythe metric in Prometheus or Grafana.documentation: This is a description of the metric. It tells us what the metric is about.labelnames: labels are tags that help group and filter your data.
For example, we can group the data bymethod(GET, POST, etc.),status_code(200, 404, etc.),path(/api/v1/users), andservice(user-service).
For instance, if a request is a GET request to/api/v1/usersand returns a 200 status code, the labels would look like:method='GET', path='/api/v1/users', status_code='200', service='user-service'.buckets: This is a list of buckets for the histogram. Each bucket represents a range of values. For example, if a request takes 0.03 seconds, it will fall into the 0.05 bucket.
# middleware_metrics.py
...
import time
from collections.abc import Callable
from fastapi import Request, Response
from starlette.middleware.base import BaseHTTPMiddleware
...

class PrometheusMetricsMiddleware(BaseHTTPMiddleware):
    ...

    async def dispatch(self, request: Request, call_next: Callable) -> Response:

        start_time = time.perf_counter() # (1)

        path = request.url.path
        method = request.method
        service_name = self.service_name

        ACTIVE_REQUESTS.labels(
            method=method,
            path=path,
            service=service_name,
        ).inc() # (5)

        # Process the request and get the response from the next middleware or endpoint.
        response = await call_next(request)
        status_code = response.status_code

        ACTIVE_REQUESTS.labels(
            method=method,
            path=path,
            service=service_name,
        ).dec() # (6)

        if status_code >= 400:
            ERROR_COUNTER.labels(
                method=method,
                status_code=500,
                path=path,
                service=service_name,
            ).inc() # (2)

        REQUEST_COUNTER.labels(
            method=method,
            status_code=status_code,
            path=path,
            service=service_name,
        ).inc() # (3)


        duration = time.perf_counter() - start_time
        REQUEST_LATENCY.labels(
            method=method,
            status_code=status_code,
            path=path,
            service=service_name,
        ).observe(duration) # (4)

...
- Start the timer for calculating the duration.
- If the status code is >= 400, increment the error counter. Remember
Counteronly goes up. - Increment the request counter.
- Add the duration to the histogram.
- Increment the active requests. Remember
Gaugecan go up and down. - Decrement the active requests because request already finish. Remember
Gaugecan go up and down.
This middleware will be called for every request and will collect the metrics for every request. We set the logic when and where to do count, observe, inc, and dec active request.
# middleware_metrics.py
...
from fastapi import FastAPI, Request, Response
from prometheus_client import generate_latest, CONTENT_TYPE_LATEST

...

def expose_metrics_endpoint() -> Response:
    return Response(
        content=generate_latest(),
        media_type=CONTENT_TYPE_LATEST,
    )
Prometheus requires the metrics to be exposed in a specific text format. This function serves as the handler for GET /metrics endpoint. Each time this called, it will be run generate_latest() that will be return the metrics in the required text format.
- generate_latest() will generate the metrics in the text format prometheus requires.
CONTENT_TYPE_LATESTis content type totext/plain; version=0.0.4; charset=utf-8which is the content type for prometheus metrics.
Here's the complete implementation of the metrics middleware for reference:
middleware_metrics.py
import time
from collections.abc import Callable

from fastapi import Request, Response
from prometheus_client import (
    CONTENT_TYPE_LATEST,
    Counter,
    Gauge,
    Histogram,
    generate_latest,
)
from prometheus_client.utils import INF
from starlette.middleware.base import BaseHTTPMiddleware

REQUEST_COUNTER = Counter(
    name="http_requests_total",
    documentation="Total count of HTTP requests",
    labelnames=["method", "status_code", "path", "service"],
)

# fmt: off
REQUEST_LATENCY = Histogram(
    name="http_request_duration_seconds",
    documentation="HTTP request latency in seconds",
    labelnames=["method", "status_code", "path", "service"],
    buckets=(
        0.005, # 5ms
        0.01,  # 10ms
        0.025, # 25ms
        0.05,  # 50ms
        0.075, # 75ms
        0.1,   # 100ms
        0.25,  # 250ms
        0.5,   # 500ms
        0.75,  # 750ms
        1.0,   # 1s
        2.5,   # 2.5s
        5.0,   # 5s
        INF,
    ),
)
# fmt: on

ERROR_COUNTER = Counter(
    name="http_errors_total",
    documentation="Total count of HTTP errors (4xx-5xx)",
    labelnames=["method", "status_code", "path", "service"],
)

ACTIVE_REQUESTS = Gauge(
    name="http_requests_active",
    documentation="Number of currently active HTTP requests",
    labelnames=["method", "path", "service"],
)


class PrometheusMetricsMiddleware(BaseHTTPMiddleware):
    async def dispatch(self, request: Request, call_next: Callable) -> Response:
        method = request.method
        path = request.url.path
        service_name = "fastapi_app"

        ACTIVE_REQUESTS.labels(
            method=method,
            path=path,
            service=service_name,
        ).inc()

        start_time = time.perf_counter()

        response = await call_next(request)

        duration = time.perf_counter() - start_time
        status_code = response.status_code

        REQUEST_COUNTER.labels(
            method=method,
            status_code=status_code,
            path=path,
            service=service_name,
        ).inc()

        REQUEST_LATENCY.labels(
            method=method,
            status_code=status_code,
            path=path,
            service=service_name,
        ).observe(duration)

        if status_code >= 400:
            ERROR_COUNTER.labels(
                method=method,
                status_code=status_code,
                path=path,
                service=service_name,
            ).inc()

        ACTIVE_REQUESTS.labels(
            method=method,
            path=path,
            service=service_name,
        ).dec()


async def expose_metrics_path(request: Request) -> Response:
    return Response(
        generate_latest(),
        media_type=CONTENT_TYPE_LATEST,
    )
⤷ Integrate the middleware to FastAPI
After we implement RED metrics via middleware, we need to integrate it to FastAPI. We can do this by adding the middleware to FastAPI app. Here is the implementation:
from middleware_metrics import PrometheusMetricsMiddleware, expose_metrics_endpoint

...
app = FastAPI(
    title="FastAPI RED Metrics",
    version="v0.0.1-local",
)

...

# Add routes
app.include_router(route_example)

# Add metrics endpoint
app.add_middleware(middleware_class=PrometheusMetricsMiddleware)
app.add_api_route(
    "/metrics",
    expose_metrics_endpoint,
    methods=["GET"],
    include_in_schema=False,
)


if __name__ == "__main__":
    import uvicorn

    print("running app")
    uvicorn.run(
        "main:app",
        host="0.0.0.0",
        port=8000,
        reload=True,  # set to False for production
    )
⤷ Sample Output GET /metrics
Every time we call GET /metrics, we will receive an structur text format output like this:
# HELP <metric_name> <description>
# TYPE <metric_name> <type>
[metric_name]{label1="value", label2="value", …} value
...
# HELP <metric_name> <description>
# TYPE <metric_name> <type>
[metric_name]{label1="value", label2="value", …} value
[metric_name]{label1="value", label2="value", …} value
# HELPis a description of about the metric. It tells us what the metric is about.# TYPEis the type of the metric. Metric type can becounter,gauge,histogram, orsummary.-
[metric_name]{label1="value", label2="value", …} valueis the metric data.metric_nameis the name of the metric.{label1="value", label2="value", …}is the labels and label values.valueis the value of the metric.
More Details
and the data it self:
http_requests_total{endpoint="/api/v1/products/:id",method="GET",service="fastapi-app--local",status_code="200"} 3.0
http_requests_total-> metric_nameendpoint=/api/v1/products/:id-> label and label value3.0-> value from the metric
So, Total count of HTTP requests with endpoint /api/v1/products/:id, method GET, service fastapi-app--local, status code 200 is 3.0
In the output we can see 3 types of metrics:
Sample Output
# HELP http_requests_total Total count of HTTP requests
# TYPE http_requests_total counter
http_requests_total{endpoint="/api/v1/products/:id",method="GET",service="fastapi-app--local",status_code="200"} 3.0
http_requests_total{endpoint="/api/v1/products",method="GET",service="fastapi-app--local",status_code="200"} 6.0
http_requests_total{endpoint="/api/v1/ai/predict",method="POST",service="fastapi-app--local",status_code="200"} 3.0
http_requests_total{endpoint="/api/v1/products/:id/process",method="POST",service="fastapi-app--local",status_code="504"} 1.0
# HELP http_request_duration_seconds HTTP request latency in seconds
# TYPE http_request_duration_seconds histogram
...
http_request_duration_seconds_bucket{endpoint="/api/v1/ai/predict/:id",le="0.005",method="GET",service="fastapi-app--local",status_code="200"} 0.0
http_request_duration_seconds_bucket{endpoint="/api/v1/ai/predict/:id",le="0.01",method="GET",service="fastapi-app--local",status_code="200"} 0.0
http_request_duration_seconds_bucket{endpoint="/api/v1/ai/predict/:id",le="0.025",method="GET",service="fastapi-app--local",status_code="200"} 0.0
http_request_duration_seconds_bucket{endpoint="/api/v1/ai/predict/:id",le="0.05",method="GET",service="fastapi-app--local",status_code="200"} 0.0
http_request_duration_seconds_bucket{endpoint="/api/v1/ai/predict/:id",le="0.075",method="GET",service="fastapi-app--local",status_code="200"} 0.0
http_request_duration_seconds_bucket{endpoint="/api/v1/ai/predict/:id",le="0.1",method="GET",service="fastapi-app--local",status_code="200"} 0.0
http_request_duration_seconds_bucket{endpoint="/api/v1/ai/predict/:id",le="0.25",method="GET",service="fastapi-app--local",status_code="200"} 2.0
http_request_duration_seconds_bucket{endpoint="/api/v1/ai/predict/:id",le="0.5",method="GET",service="fastapi-app--local",status_code="200"} 3.0
http_request_duration_seconds_bucket{endpoint="/api/v1/ai/predict/:id",le="0.75",method="GET",service="fastapi-app--local",status_code="200"} 3.0
http_request_duration_seconds_bucket{endpoint="/api/v1/ai/predict/:id",le="1.0",method="GET",service="fastapi-app--local",status_code="200"} 3.0
http_request_duration_seconds_bucket{endpoint="/api/v1/ai/predict/:id",le="2.5",method="GET",service="fastapi-app--local",status_code="200"} 3.0
http_request_duration_seconds_bucket{endpoint="/api/v1/ai/predict/:id",le="5.0",method="GET",service="fastapi-app--local",status_code="200"} 3.0
http_request_duration_seconds_bucket{endpoint="/api/v1/ai/predict/:id",le="+Inf",method="GET",service="fastapi-app--local",status_code="200"} 3.0
http_request_duration_seconds_count{endpoint="/api/v1/ai/predict/:id",method="GET",service="fastapi-app--local",status_code="200"} 3.0
http_request_duration_seconds_sum{endpoint="/api/v1/ai/predict/:id",method="GET",service="fastapi-app--local",status_code="200"} 0.8044325950322673
...
from this output we can see that:
- Bucket Distribution:
http_request_duration_seconds_bucketlehere means less than or equal to- the endpoint
/api/v1/ai/predict/:idhas:- 2 requests with duration < 0.25 second
- 3 requests with duration < 0.5 second
- 3 requests with duration < 0.75 second
- and so on
http_request_duration_seconds_count: total number of requests processhttp_request_duration_seconds_sum: total duration of requests process
and you can just calculate the average duration of this endpoint by:
# HELP http_requests_active Number of currently active HTTP requests
# TYPE http_requests_active gauge
http_requests_active{endpoint="/api/v1/products/:id",method="GET",service="fastapi-app--local"} 0.0
http_requests_active{endpoint="/api/v1/products",method="GET",service="fastapi-app--local"} 0.0
http_requests_active{endpoint="/api/v1/ai/predict",method="POST",service="fastapi-app--local"} 0.0
http_requests_active{endpoint="/api/v1/products/:id/process",method="POST",service="fastapi-app--local"} 0.0
in this output we can see that http_requests_active is 0.0 because there are no active requests. This is similar to Counter, but this can go up and down.
But you may notice that there are things that we don't set, but appear in the output.
Default Metrics Output
# HELP python_gc_objects_collected_total Objects collected during gc
# TYPE python_gc_objects_collected_total counter
python_gc_objects_collected_total{generation="0"} 7217.0
python_gc_objects_collected_total{generation="1"} 3167.0
python_gc_objects_collected_total{generation="2"} 430.0
# HELP python_gc_objects_uncollectable_total Uncollectable objects found during GC
# TYPE python_gc_objects_uncollectable_total counter
python_gc_objects_uncollectable_total{generation="0"} 0.0
python_gc_objects_uncollectable_total{generation="1"} 0.0
python_gc_objects_uncollectable_total{generation="2"} 0.0
# HELP python_gc_collections_total Number of times this generation was collected
# TYPE python_gc_collections_total counter
python_gc_collections_total{generation="0"} 140.0
python_gc_collections_total{generation="1"} 12.0
python_gc_collections_total{generation="2"} 1.0
# HELP python_info Python platform information
# TYPE python_info gauge
python_info{implementation="CPython",major="3",minor="12",patchlevel="9",version="3.12.9"} 1.0
# HELP process_virtual_memory_bytes Virtual memory size in bytes.
# TYPE process_virtual_memory_bytes gauge
process_virtual_memory_bytes 6.8268032e+07
# HELP process_resident_memory_bytes Resident memory size in bytes.
# TYPE process_resident_memory_bytes gauge
process_resident_memory_bytes 4.9651712e+07
# HELP process_start_time_seconds Start time of the process since unix epoch in seconds.
# TYPE process_start_time_seconds gauge
process_start_time_seconds 1.74011031125e+09
# HELP process_cpu_seconds_total Total user and system CPU time spent in seconds.
# TYPE process_cpu_seconds_total counter
process_cpu_seconds_total 6.33
# HELP process_open_fds Number of open file descriptors.
# TYPE process_open_fds gauge
process_open_fds 24.0
# HELP process_max_fds Maximum number of open file descriptors.
# TYPE process_max_fds gauge
process_max_fds 1.048576e+06
These metrics are automatically generated by prometheus-client and registered by default collectors. They provide additional insights into application performance, such as memory usage, CPU time, and garbage collection. We can use it to monitoring our application performance too or if you just want to monitor the metrics that you define, you can disable it this way
Next Step
This concludes part 1 of the tutorial. In the next part, we will integrate the application with Prometheus and Grafana for monitoring and visualization. However, There are many things to do next, such as:
- Integrate with Prometheus as Time Series Database
- Integrate with Grafana as Visualization
- Exclude some endpoints from metrics collection. for example, we don't want to collect
GET /metrics,GET /docs,GET /redoc, etc. - Replace the unique id with
:idon the path (endpoint) to decrease cardinality. Cardinality is the number of unique values for a label. The more unique values, the more memory it will consume. - Add alerts.
- so on...
For more details
Few of next step already implemented in source code. Please check the source code for more details.
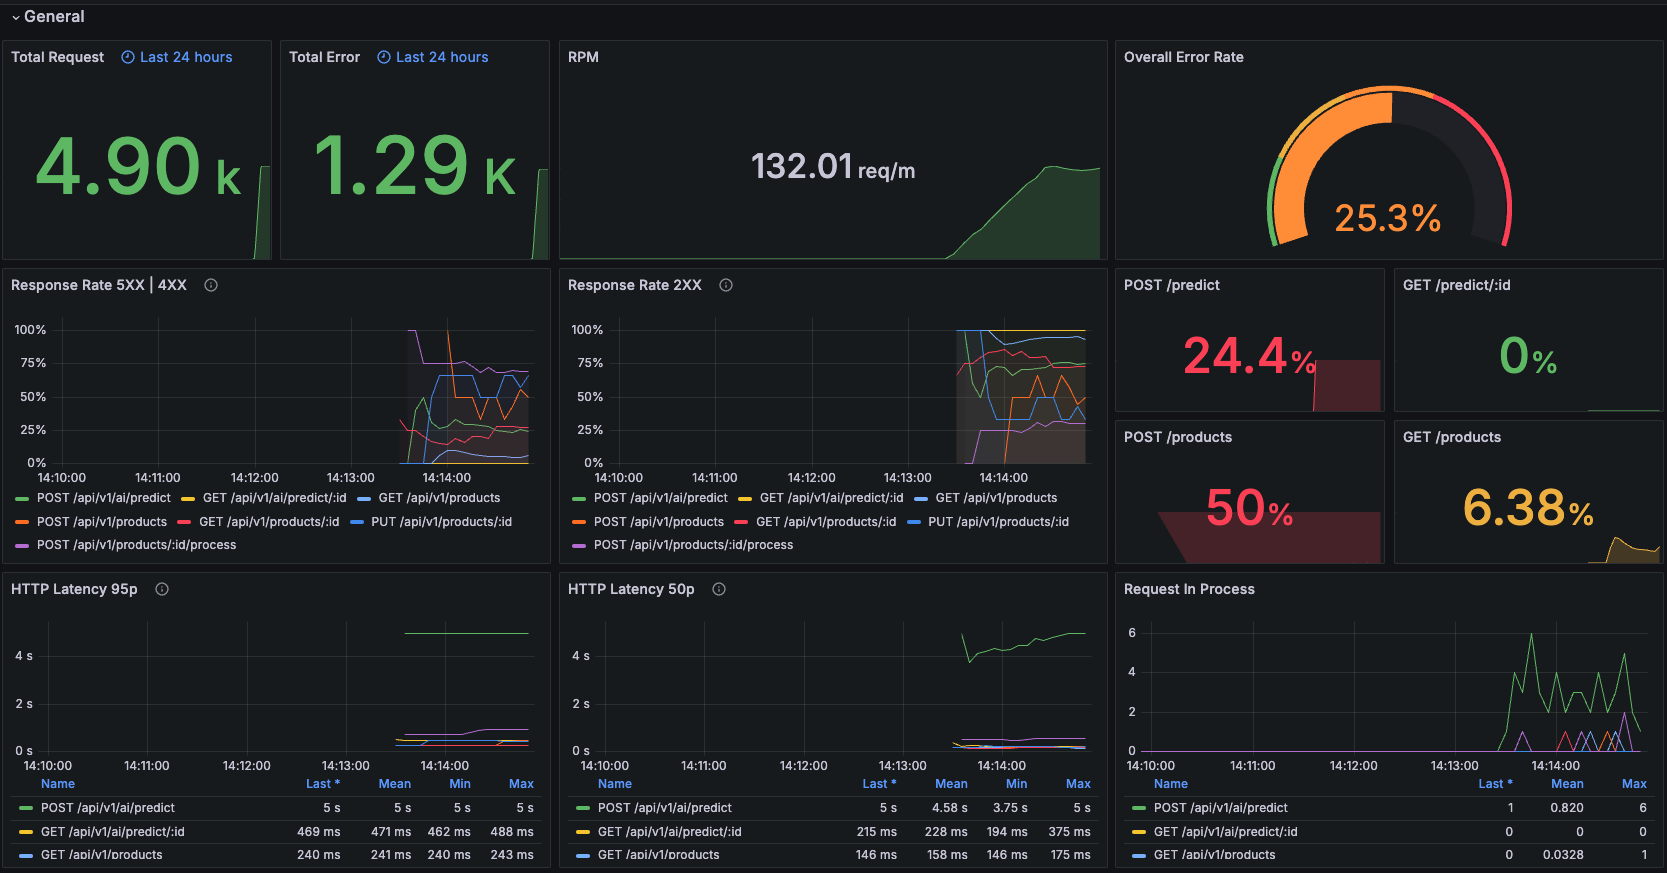
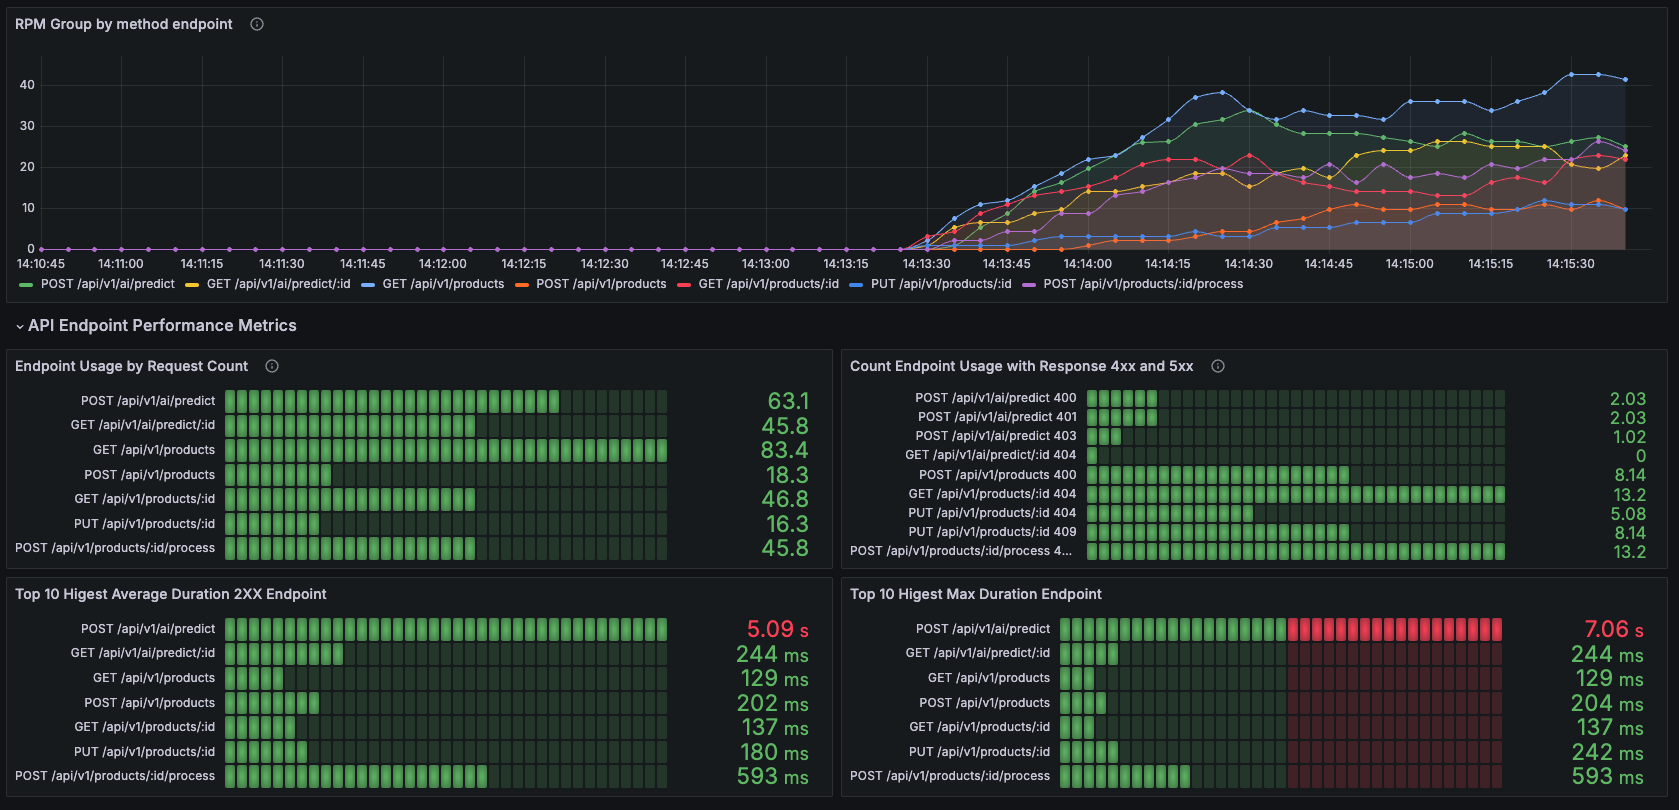
Here some of the example dashboard:
Reference:
- Prometheus and Grafana
- Github FastAPI Observability
- Instrumenting FastAPI Apps with Prometheus Metrics
- Prometheus Client